- Save the Children State of the World's Mothers report
-
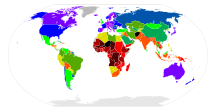 The lifetime risk of maternal death from pregnancy-related causes from the SOWM2010 report. Each color represents a twofold difference
— risk more than one in:
Millennium Development Goal 5 represents a change of two colors (75% reduction) for each nation.81632641282505001000200040008000160003200064000The Save the Children State of the World's Mothers report (SOWM report)[1] is an annual report by the International Save the Children Alliance, which compiles statistics on the health of mothers and children and uses them to produce rankings of nations within three groupings corresponding to varying levels of economic development.[2][3][4] The reports compile a Women's Index and a Children's Index for countries for which sufficient data could be collected, and a Mother's Index where both of these could be calculated. The reports have been produced annually since the year 2000.[5]
The recent SOWM 2010 report ranked Norway as the best country to be a mother, and Afghanistan the worst. The United States ranked only 26th among industrialized nations, in part because more young mothers died during childbirth or in following years than in many other countries and due to a poor standard for maternity leave and benefits. Among the middle-income nations Cuba was ranked highest, surpassing some of the wealthier nations. In poorer countries the intervention of female health workers was the most important factor, because in many cases women were prevented from seeing male doctors and traditional advice within families was unreliable.[6]
Contents
Findings
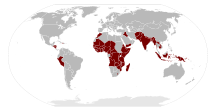 Nations identified with critical shortages of health care workers
The report describes several key findings:[7]
- There are 57 countries with critical shortages of healthcare personnel.
- Midwives and other female healthcare workers are especially important.
- Small amounts of spending on community healthcare workers can be helpful: workers with six weeks' training in Bangladesh reduced newborn mortality by 34%.
- Educating family members is an effective tool.
- Countries that "train and deploy more front-line female health workers" have greatly reduced infant mortality (42 and 64% in Indonesia and Bangladesh).
Press coverage
The reports have been widely covered in the world press, with attention for local strengths and weaknesses. For example, USA Today focused on the low ranking of the U.S. (28th place, below Estonia, Latvia, and Croatia) due to high rates of maternal and infant mortality, low preschool enrollment, and a particularly weak maternal leave benefit.[8] It quoted the report:[9]
"A woman in the United States is more than five times as likely as a woman in Bosnia and Herzegovina, Greece or Italy to die from pregnancy-related causes in her lifetime and her risk of maternal death is nearly 10-fold that of a woman in Ireland"
ABC News interviewed physicians and nonprofit leaders who questioned whether global comparisons could be made reliably, due to possible differences in the definition of ectopic pregnancy, stillbirth, and abortion statistics. Relevant factors may include lack of health insurance, illegal immigration by women with poor prenatal care, and maternal obesity statistics, but according to Michael Katz, a senior vice president at the March of Dimes Birth Defects Foundation, "The major question I would ask is, 'Why do African American populations have worse results than the white population?'"[10]
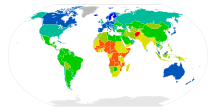 Infant mortality rates before age 5. Map colors mark rates per 1000 of at least:348163264128257
Pravda.ru and Sify picked up an IANS/EFE report focusing on Cuba's rating as the best place to be a mother in the developing world.[11][12] The Herald Sun boasted Australia's second-best placement for mothers, quoting a happy mother about hospital, maternal and child health support, and 12-month workplace maternal leave.[13] However, the Adelaide Advertiser focused on Australia's lower [28th] ranking on the Children's Index, due in part to a child mortality rate three times higher for aboriginal infants.[14] It quoted Save The Children's Annie Pettitt:
An important first step would be to tackle the shortfall of almost 2000 midwives in Australia, especially in remote and rural areas where we know the shortage is greatest
An editorial in the Philippine Daily Inquirer discussed explanations for the Philippine's 48th-place ranking in the second tier. The column attributed much of the problem to a "brain drain", though it described as "much too high" the SOWM report's figure that 85% of Filipino nurses leave to pursue better pay and standards of living overseas. It questioned standards at "diploma mills" and called for incentives to bring health professionals into poor communities, while criticizing the chilling effects of a "raid on a training session of health-care workers" as subversives in Morong, Rizal. The Philippines local chapter of Save the Children produced a State of Filipino Mothers report in 2008 with rankings by province.[15]
The Times of India lamented India's 73rd of 77th place in the second tier, describing a critical shortage of 74,000 Ashas and 21,066 auxiliary nurse midwives below governmental norms, and that thousands of women were dying because they could not access the most basic healthcare facilities, or that if they were available they were of low quality.[16]
Though data for some countries are not known with much certainty, the SOWM 2010 report has many findings in common with a recent study published in The Lancet, which found that 23 of 181 countries are on track to achieve Millennium Development Goal 5 of a 75% reduction in maternal mortality rate between 1990 and 2015.[17][18]
Activism
The 2010 report was released by Save the Children in Canada on May 4, 10:00 a.m., as a part of an action directed toward members of Parliament in support of an announcement by Prime Minister Stephen Harper that child and maternal health would be the top priority at the 36th G8 summit in Huntsville, Ontario in June. As described in the press release:[19]
In the week leading up to Mother's Day, 5,700 mothers around the world will die. During this Mother's Day week, CARE, the Canadian Association of Midwives, Plan Canada, Results, Save the Children Canada, the Society of Obstetricians and Gynaecologists of Canada, UNICEF and World Vision have joined forces in Ottawa to get the attention of the government and public, to have Canada put its leadership at the upcoming G8 into action and stop preventable child and maternal deaths
Data
The dataset on which the rankings are based is as follows:[20]
Nation Lifetime risk of maternal death (1 in N) % births attended by skilled health personnel % using modern contraception Female life expectancy at birth Expected years formal schooling for females Maternal leave (days) Maternal leave (% wages) Ratio estimated male to female income % national government seats held by women Under 5 mortality per 1000 births % children moderately or severely underweight Gross pre-primary enrollment ratio (%) Ratio of girls to boys enrolled in primary school Gross secondary enrollment ratio (%) % with access to safe drinking water Economic tier Mother's Index rank in tier Women's Index rank in tier Children's Index rank in tier 2005 2008 2008 2009 2008 2009 2009 2007 2010 2008 2008 2008 2008 2008 2006 2010 2010 2010 Albania 490 22 80 11 365 80, 50[21] 0.54 16 14 49 78 1 43 43 42 Australia 13300 71 84 21 365 —[22] 0.7 27 6 101 148 1 2 1 28 Austria 21500 47 83 15 112[23] 100 0.4 28 4 92 100 1 26 33 5 Belarus 4800 56 76 15 126 100 0.63 32 13 102 95 1 33 28 36 Belgium 7800 73 83 16 105 82, 75[24][25] 0.64 38 5 121 110 1 9 11 13 Bosnia and Herzegovina 29000 11 78 13[26] 365 50-100 0.61 19 15 11 89 1 41 36 43 Bulgaria 7400 40 77 14 135[27] 90 0.68 21 11 82 105 1 34 31 31 Canada 11000 72 83 16 119 55[25][28] 0.65 22 6 70 101 1 20 17 21 Croatia 10500 — 80 14 365 100[29][30] 0.67 24 6 51 94 1 27 25 32 Czech Republic 18100 63 80 16 196[23] 69 0.57 16 4 114 95 1 23 27 13 Denmark 17800 72 81 18 364 100[25] 0.74 38 4 96 119 1 5 4 19 Estonia 2900 56 79 17 140[23] 100 0.65 23 6 95 100 1 17 19 13 Finland 8500 75 83 18 105[23][27] 70[31] 0.73 40 3 64 111 1 7 6 18 France 6900 77 85 16 112[23] 100[25] 0.61 19 4 113 113 1 12 13 4 Germany 19200 66 83 16[26] 98[23] 100[25] 0.59 33 4 108 101 1 9 14 3 Greece 25900 46 82 17 119[27] 50[22][32] 0.51 17 4 69 102 1 24 26 17 Hungary 13300 71 78 16 168[23] 70 0.75 11 7 89 97 1 21 15 23 Iceland 12700 — 84 20 91 80 0.62 43 3 96 110 1 3 5 6 Ireland 47600 66 83 18 182 80[25][31] 0.56 14 4 — 113 1 11 8 26 Italy 26600 41 84 17 152 80 0.49 21 4 101 100 1 17 24 2 Japan 11600 44 87 15 98 67[22] 0.45 11 4 88 101 1 32 38 6 Latvia 8500 56 78 17 112 100 0.67 22 9 90 115 1 25 19 33 Lithuania 7800 33 78 17 126 100 0.7 19 7 69 99 1 22 21 27 Luxembourg 5000 — 82 13 112 100 0.57 20 3 86 95 1 29 34 9 Macedonia 6500 10 77 12 274 —[33] 0.49 33 11 38 84 1 42 42 40 Malta 8300 43 82 15 98 100[34] 0.45 9 6 101 98 1 35 41 13 Moldova, Republic of 3700 43 73 12 126 100 0.73 24 17 72 83 1 40 38 41 Montenegro 4500[35] 17 77 — — — 0.58 11 8 — — 1 — — — Netherlands 10200 65 82 17 112 100[25] 0.67 42 5 101 120 1 8 9 22 New Zealand 5900 72 82 20 98 100[25] 0.69 34 6 93 120 1 Norway 7700 82 83 18 322-392[23] 80-100[36] 0.77 40 4 92 113 1 1 2 9 Poland 10600 28 80 16 112[23] 100 0.59 20 7 60 100 1 29 29 29 Portugal 6400 63 82 16 120[27] 100 0.6 27 4 80 101 1 19 22 8 Romania 3200 38 77 15 126 85 0.68 11 14 72 87 1 37 32 39 Russian Federation 2700 53 73 14 140 100[22][25] 0.64 14 13 89 84 1 38 35 38 Serbia 4500[35] 19 77 14 365 100[37] 0.59 22 7 57 90 1 36 40 35 Slovakia 13800 66 79 15 196[23] 55 0.58 18 8 94 93 1 31 30 30 Slovenia 14200 63 82 18 105 100 0.61 14 4 80 94 1 16 12 20 Spain 16400 62 84 17 112[23] 100 0.52 37 4 123 119 1 13 15 11 Sweden 17400 65 83 16 480 80[25][38] 0.67 46 3 101 103 1 3 7 1 Switzerland 13800 78 84 15 98 80[25] 0.62 29 5 101 96 1 15 18 12 Ukraine 5200 48 74 15 126[27] 100 0.59 8 16 98 94 1 39 37 37 United Kingdom 8200 82[39] 82 16 364 90[40] 0.67 20 6 73 97 1 14 10 24 United States 4800 68 82 16 84 —[41] 0.62 17[42] 8 61 94 1 28 23 34 Algeria 220 95 52 74 13 0.36 8 41 4 108 83 85 2 52 52 41 Argentina 530 99 64 79 17 0.51 39 16 4 115 85 96 2 3 4 13 Armenia 980 100 19 77 12 0.57 9 23 4 80 88 98 2 35 36 37 Azerbaijan 670 88 13 73 13 0.44 11 36 10 116 106 78 2 53 51 54 Bahamas 2700 99 60 77 12 0.72 12 13 — 102 94 97[43] 2 9 12 5 Bahrain 1300 98 31[44] 78 15 0.51 3 12 9 105 97 — 2 24 26 17 Barbados 4400 100 53 80 16 0.65 10 11 6[43] 105 103 100 2 3 3 2 Belize 560 95 31 79 12 0.43 0 19 6 120 75 91[43] 2 51 54 30 Bolivia, Plurinational State of 89 66 34 68 14 0.61 25 54 6 108 82 86 2 33 29 52 Botswana 130 94 42 55 12 0.58 8 31 13 110 80 96 2 46 45 45 Brazil 370 97 70 76 14 0.6 9 22 2[26] 130 100 91 2 15 15 19 Brunei Darussalam 2900 99 — 80 14 0.59 — 7 — 107 97 — 2 — — — Cameroon 24 63 12 52 9 0.53 14 131 19 111 37 70 2 71 69 76 Cape Verde 120 78 46[43] 74 11 0.49 18 29 9 101 68 80[43] 2 48 50 49 Chile 3200 100 58[43] 82 14 0.42 14 9 1 106 91 95 2 13 20 4 China 1300 98 86 75 11 0.68 21 21 7 112 74 88 2 18 13 42 Colombia 290 96 68 77 14 0.71 8 20 7 120 91 93 2 13 10 33 Congo 22 83 13 55 8 0.51 7 127 14 114 43 71 2 71 71 74 Costa Rica 1400 99 72 82 12 0.46 37[26] 11 5 110 89 98 2 12 21 12 Côte d'Ivoire 27 57 8 59 5 0.34 9 114 20 74 26 81 2 76 76 78 Cuba 1400 100 72 81 19 0.49 43 6 4 102 91 91 2 1 1 10 Cyprus 6400 100[43] — 82 14 0.58 13 4 — 102 98 100 2 6 8 1 Dominican Republic 230 98 70 76 13 0.59 20 33 4 104 75 95 2 21 19 26 Ecuador 170 99 58 78 14 0.51 32 25 9 118 70 95 2 18 17 40 Egypt 230 79 58 72 10 0.27 2 23 8 100 79 98 2 57 61 24 El Salvador 190 92 66 76 12 0.46 19 18 9 115 64 84 2 41 39 56 Fiji 160 99 — 71 13 0.38 — 18 8[43] 94 81 47 2 — — 68 Gabon 53 86 12 62 12 0.59 15 77 12 134 53 87 2 57 45 70 Georgia 1100 98 27 75 13 0.38 7 30 2 107 90 99 2 43 55 10 Ghana 45 55 17 58 9 0.74 8 76 14[26] 102 54 80 2 64 59 69 Guatemala 71 41 34 74 10 0.42 12 35 23 114 57 96 2 66 66 63 Guyana 90 83 33 71 12 0.41 30 61 12 109 102 93 2 45 48 48 Honduras 93 67 56 75 12 0.34 18 31 11 116 65 84 2 60 58 58 India 70 47 49 66 10 0.32 11 69 48 113 57 89 2 73 74 75 Indonesia 97 79 57 73 13 0.44 18 41 18[26] 121 76 80 2 54 44 66 Iran, Islamic Republic of 300 97 59 73 15 0.32 3 32 5 128 80 94[43] 2 42 43 35 Iraq 72 80 33 72 8 — 26 44 8 98 47 77 2 — — 64 Israel 7800 99[43] 52[45] 83 16 0.64 19 5 — 111 91 100 2 2 2 2 Jamaica 240 97 66 76 12 0.58 13 31 2[26] 90 90 93 2 29 30 29 Jordan 450 99 41 75 13 0.19 6 20 4 96 86 98 2 56 61 14 Kazakhstan 360 100 49 72 16 0.68 18 30 4 108 92 96 2 8 9 21 Kenya 39 42 32 55 9 0.65 10 128 21 112 58 57 2 70 64 79 Korea, Democratic People's Republic of 140 97 58 70 — — 16 55 23 — — 100 2 — — — Korea, Republic of 6100 100 75 83 16 0.52 15 5 — 104 97 92[43] 2 5 6 7 Kuwait 9600 98 39[44] 80 13 0.36 8 11 10 95 91 — 2 30 30 27 Kyrgyzstan 240 98 46 72 13 0.55 26 38 3 95 85 89 2 25 24 38 Lebanon 290 98 34 74 14 0.25 3 13 4 101 82 100 2 48 60 6 Libyan Arab Jamahiriya 350 94 26 77 17 0.25 8 17 5 110 93 72[43] 2 43 41 46 Malaysia 560 98 30[46] 77 13 0.42 10 6 8 98 69 99 2 38 45 22 Mauritius 3300 98 39 76 13 0.42 17 17 15 99 88 100 2 31 35 27 Mexico 670 93 67 79 14 0.42 28 17 5 113 87 95 2 21 26 18 Micronesia, Federated States of — 88 21 75 12[26] — 0 39 15 110 91 94 2 — — 49 Mongolia 840 99 61 70 14 0.87 4 41 6 102 95 72 2 10 4 53 Morocco 150 63 52 74 10 0.24 11 36 10 107 56 83 2 68 73 61 Namibia 170 81 54 62 12 0.63 27 42 21 112 66 93 2 37 30 65 Nicaragua 150 74 69 77 11 0.34 21 27 7 117 68 79 2 57 57 59 Nigeria 18 39 9 49 8 0.42 7 186 27 93 30 47 2 77 75 80 Occupied Palestinian Territory — 99 39 75 14 0.12[43] — 27 3 80 92 89 2 — — 42 Oman 420 99 18[44] 78 11 0.23 0 12 18 75 88 79[43] 2 69 70 67 Pakistan 74 39 22 67 6 0.18 22 89 38 85 33 90 2 75 76 77 Panama 270 92 54[43] 79 14 0.58 9 23 8 111 71 92 2 26 21 39 Papua New Guinea 55 53 20 64 6 0.74 1 69 26 55 — 40 2 74 72 81 Paraguay 170 82 70 74 12 0.64 13 28 4 108 66 77 2 34 28 54 Peru 140 71 47 76 14 0.59 28 24 5 113 98 84 2 17 18 31 Philippines 140 62 36 74 12 0.58 21 32 28 108 81 93 2 48 41 62 Qatar 2700 99 32[44] 77 15 0.28 0 10 6 109 93 100 2 39 49 9 Saudi Arabia 1400 91 29[43][44] 76 13 0.16 0 21 14 98 95 95[43] 2 62 67 32 Singapore 6200 100 53 83 — 0.53 23 3 3 — — 100[43] 2 — — — South Africa 110 91 60 53 14[26] 0.6 45[47] 67 12 105 95 93 2 16 14 51 Sri Lanka 850 99 53 78 13[26] 0.56 6 15 22[26] 105 87 82 2 40 33 60 Suriname 530 90 41 73 13 0.44 26 27 10 114 75 92 2 36 38 47 Swaziland 120 69 47 46 10 0.71 14 83 7 108 53 60 2 63 53 72 Syrian Arab Republic 210 93 43 76 11[26] 0.2 12 16 10 124 74 89 2 64 68 42 Tajikistan 160 88 33 70 10 0.65 20[26] 64 18 102 84 67 2 55 40 71 Thailand 500 97 80 72 14[26] 0.63 13 14 9 104 83 98 2 11 10 19 Trinidad and Tobago 1400 98 38 73 12 0.55 27 35 6 103 89 94 2 27 34 25 Tunisia 500 95 52 76 15 0.28 28 21 3 108 90 94 2 28 36 14 Turkey 880 91 43 75 11 0.26 9 22 3 98 82 97 2 60 65 16 Turkmenistan 290 100 45 69 — 0.65 17 48 11 — — 72[43] 2 — — — United Arab Emirates 1000 99 24[44] 79 12 0.27 23 8 14 108 94 100 2 46 56 23 Uruguay 2100 100 75 80 16 0.55 15 14 5 114 92 100 2 7 7 8 Uzbekistan 1400 100 59 71 11 0.64 22 38 5 94 102 88 2 23 23 36 Venezuela, Bolivarian Republic of 610 95 62 77 15 0.48 18 18 5 103 81 83[43] 2 20 16 34 Vietnam 280 88 68 77 10 0.69 26 14 20 108 67 92 2 31 24 57 Zimbabwe 43[26] 69 58 46 9 0.58[43] 15 96 17 104 41 81 2 67 61 73 Afghanistan 8 14 16 44 5 0.24 27 257 39 106 0.66 22 3 40 40 42 Angola 12 47 5 50 4[26] 0.64 39 220 16[26] 84 0.83 51 3 30 29 34 Bangladesh 51 18 48 68 8 0.51 19 54 46 94 1.07 80 3 15 15 14 Benin 20 74 6 63 6 0.52 11 121 23 117 0.87 65 3 26 28 17 Bhutan 55 71 31 68 11 0.39 9 81 19 106 1 81 3 6 12 3 Burkina Faso 22 54 13 55 5 0.66 15 169 32 73 0.87 72 3 27 26 31 Burundi 16 34 9 52 7 0.77 31 168 39 136 0.95 71 3 17 14 27 Cambodia 48 44 27 63 9 0.68 21 90 36 116 0.94 65 3 10 8 21 Central African Republic 25 53 9 49 — 0.59 10 173 29 77 0.71 66 3 — — 37 Chad 11 14 2 50 4 0.7 5 209 37 83 0.7 48 3 38 35 40 Comoros 52 62 19 68 10 0.58 0 105 25 122 0.88 85 3 12 11 8 Congo, Democratic Republic of the 13 74 6 49 6 0.46 8 199 31 90 0.83 46 3 35 32 39 Djibouti 35 61 17 57 4 0.57 14 95 33 55 0.88 92 3 28 30 17 Equatorial Guinea 28 65 6 52 7 0.36 10 148 19 99 0.95 43 3 31 31 24 Eritrea 44 28 5 62 5 0.5 22 58 40 52 0.82 60 3 32 34 33 Ethiopia 27 6 14 57 7 0.67 22 109 38 98 0.89 42 3 25 20 32 Gambia 32 57 13 58 8 0.63 8 106 20 86 1.06 86 3 13 17 5 Guinea 19 46 4 60 7 0.68 —[48] 146 26 90 0.85 70 3 23 22 23 Guinea-Bissau 13 39 6 50 5 0.46 10 195 19 120 0.67 57 3 37 38 35 Haiti 44 26 24 63 — 0.37 4 72 22 — — 58 3 — — — Lao People's Democratic Republic 33 20 29 67 8 0.76 25 61 37 112 0.91 60 3 9 6 19 Lesotho 45 55 35 46 10 0.73 24 79 14[26] 108 0.99 78 3 3 3 2 Liberia 12 46 10 60 9 0.5 13 145 24 91 0.9 64 3 21 21 22 Madagascar 38 51 17 63 10 0.71 9[26] 106 42 152 0.97 47 3 14 8 30 Malawi 18 54 38 55 9 0.74 21 100 21 120 1.03 76 3 4 6 7 Maldives 200 84 34 74 12 0.54 7 28 30 112 0.94 83 3 1 1 4 Mali 15 49 6 49 7 0.44 10 194 32 91 0.83 60 3 34 33 36 Mauritania 22 61 8 59 8 0.58 22 118 31 98 1.07 60 3 19 18 20 Mozambique 45 55 12 49 7 0.9 39 130 18 114 0.88 42 3 8 4 26 Myanmar 110 57 33 64 9[26] 0.61 — 98 32 115 0.99 80 3 — — 9 Nepal 31 19 44 68 8 0.61 33 51 45 124 0.95 89 3 10 10 12 Niger 7 33 5 53 4 0.34 12[26] 167 43 58 0.78 42 3 39 39 41 Rwanda 16 52 26 53 9 0.79 56 112 23 151 1.01 65 3 2 2 10 Senegal 21 52 10 58 7 0.55 23 108 17 84 1.02 77 3 18 23 6 Sierra Leone 8 43 6 49 6 0.74 13 194 21[26] 158 0.88 53 3 29 25 38 Solomon Islands 100 70 — 68 9 0.51 0 36 12[26] 107 0.97 70 3 7 13 1 Somalia 12 33 1 52 — — 7 200 36 — — 29 3 — — — Sudan 53 49 6 60 5[26] 0.33 19 109 31 69 0.88 70 3 32 36 25 Tanzania, United Republic of 24 43 20 57 5 0.74 31 104 22 110 0.99 55 3 16 18 13 Timor-Leste 35 18 7 63 10[26] 0.53 29 93 49 107 0.94 62 3 19 16 28 Togo 38 62 11 65 8[26] 0.45 11 98 21 105 0.86 59 3 21 24 14 Uganda 25 42 18 54 10 0.69 32 135 20 120 1.01 64 3 5 5 11 Yemen 39 36 19 65 7 0.25 0.3 69 46 85 0.8 66 3 36 37 29 Zambia 27 47 27 47 7 0.56 14 148 19 119 0.98 58 3 23 26 16 2005 2008 2008 2009 2008 2009 2009 2007 2010 2008 2008 2008 2008 2008 2006 2010 2010 2010 Additional maps (statistics pertaining to females)
 Years formal schooling
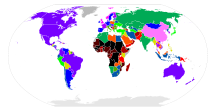 Modern contraception usage
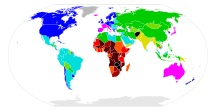 Lifespan
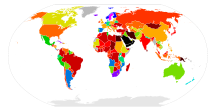 National government seats
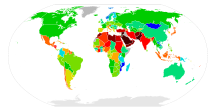 Earned income relative to males
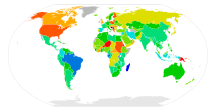 Gross preprimary enrollment ratio
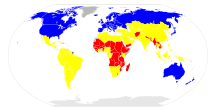 Tiers used in the rankings. 1, blue; 2, yellow; 3, red.
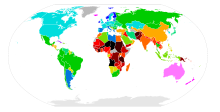
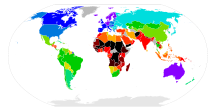 Rankings in the SOWM Mother's Index. Note: this map is colored as if rankings in different tiers cannot overlap, which may not be true.
See also
- World Health Report
- Maternal health
References
- ^ Save the Children (2010-05). "State of the World's Mothers". http://www.savethechildren.org/publications/state-of-the-worlds-mothers-report/SOWM-2010-Women-on-the-Front-Lines-of-Health-Care.pdf. (the SOWM 2010 report in PDF format)
- ^ International Save the Children Alliance (2010-05-03). "State of the World's Mothers Report 2010: Best and Worst Places to be a Mother". Reuters AlertNet. http://www.alertnet.org/thenews/fromthefield/SaveChAlli/0c15c49b9477bfc19f22f16e2b7b5310.htm.
- ^ Marcela Sanchez (2006-05-11). "World Mother's Report:Small Changes Can Save Small Lives". Washington Post. http://www.washingtonpost.com/wp-dyn/content/article/2006/05/11/AR2006051101073.html.
- ^ Celia W. Dugger (2007-05-08). "Report on Child Deaths Finds Some Hope in Poorest Nations". New York Times. http://www.nytimes.com/2007/05/08/world/08children.html.
- ^ See [1] for links to all of the annual SOWM reports.
- ^ Donald G. McNeil (2010-05-17). "Motherhood: Norway Tops List of the Best Places to Be a Mother; Afghanistan Rates Worst". New York Times. http://www.nytimes.com/2010/05/18/health/18glob.html.
- ^ SOWM 2010 report, pp. 5-6.
- ^ Michael Winter (2010-05-04). "Survey ranks Norway best for mothers, U.S. 28th". USA Today. http://content.usatoday.com/communities/ondeadline/post/2010/05/survey-ranks-norway-best-for-mothers-us-28th/1?csp=34.
- ^ SOWM 2010 report, p. 34
- ^ "Where's the Best Place to be a Mom?". ABC News. 2010-05-08. http://abcnews.go.com/Health/ReproductiveHealth/us-ranks-28th-best-worst-places-mother/story?id=10576232&page=3.
- ^ "Cuba Provides Best Conditions for Motherhood in the World". Pravda.ru. 2010-05-05. http://english.pravda.ru/news/world/05-05-2010/113269-motherhood-0.
- ^ IANS/EFE (2010-05-05). "Cuba rated best place to be a mother in developing world". Sify.com. http://sify.com/news/cuba-rated-best-place-to-be-a-mother-in-developing-world-news-international-kffhEcadffc.html.
- ^ Marianne Betts (2010-05-05). "We are great for mothers". Herald Sun. http://www.heraldsun.com.au/news/national/we-are-great-for-mothers/story-e6frf7l6-1225862297390?from=public_rss.
- ^ Edwina Scott (2010-05-04). "Australia second best country in world to be a mum - report". AdelaideNow. http://www.adelaidenow.com.au/news/national/australia-second-best-country-in-world-to-be-a-mum-report/story-e6frea8c-1225861980491?from=public_rss.
- ^ Michael Tan (2010-05-11). "Mothers and elections". Philippine Daily Inquirer. http://opinion.inquirer.net/inquireropinion/columns/view/20100511-269487/Mothers-and-elections.
- ^ Times News Network (2010-05-04). "India among worst places to become a mother: Survey". The Times of India. http://timesofindia.indiatimes.com/India/India-among-worst-places-to-become-a-mother-Survey/articleshow/5887980.cms.
- ^ Jo Chandler (2005-05-08). "The toughest kind of labour". The Age. http://www.theage.com.au/national/the-toughest-kind-of-labour-20100507-ujtn.html.
- ^ {{cite weburl=http://www.thelancet.com/journals/lancet/article/PIIS0140-6736%2810%2960518-1/fulltext%7Ctitle=Maternal mortality for 181 countries, 1980—2008: a systematic analysis of progress towards Millennium Development Goal 5|date=2010-05-08|journal=The Lancet|author=Margaret C. Hogan et al.|volume=375|issue=9726|page=1609-23|doi=doi:10.1016/S0140-6736(10)60518-1}}
- ^ World Vision Canada. "Media Advisory - A week to save moms and their kids". CNW Group. http://www.newswire.ca/en/releases/archive/April2010/30/c7095.html.
- ^ SOWM 2010 report, pp. 39-42.
- ^ "80% prior to birth and for 150 days after and 50% for the rest of the leave period"
- ^ a b c d "A lump sum grant is provided for each child"
- ^ a b c d e f g h i j k "These countries also offer prolonged periods of leave (at least 2 years)" Additional information on child-related leave entitlements is available from the [www.oecd.org/els/social/family/database OECD Family database]
- ^ 82% for the first 30 days and 75% afterward
- ^ a b c d e f g h i j k "Up to a ceiling"
- ^ a b c d e f g h i j k l m n o p q r s t u v w x y z "Data differ from the standard definition and/or are from a secondary source"
- ^ a b c d e With a few exceptions, the report describes leave in chronological days, weeks, months, or one year. The figure for Finland is in working days, and for other entries marked with this note it is unspecified.
- ^ "Benefits vary by province and jurisdiction"
- ^ 45 days before delivery and 1 year after
- ^ 100% until the child reaches the first 6 months, and a "flat rate" thereafter.
- ^ a b "Benefits vary, but there is a minimum flat rate"
- ^ "50% plus a dependent's supplement (10% each, up to 40%)"
- ^ Payment unspecified
- ^ For the first 91 days
- ^ a b Data refer to Serbia and Montenegro before June 2006.
- ^ 100% for a 46-week option or 80% for a 56-week option
- ^ "100% of earnings paid for the first 6 months, 60% from the 6th-9th month; 30% for the last 3 months"
- ^ 80% for the first 390 days; "flat rate for remaining 90."
- ^ Excluding Northern Ireland
- ^ 90% for the first 42 days, "flat rate for the remaining weeks."
- ^ No national program: "cash benefits may be provided at the state level"
- ^ "The total refers to all voting members of the House"
- ^ a b c d e f g h i j k l m n o p q r s t u Data "from an earlier publication of the same source"
- ^ a b c d e f "Data pertain to nationals of the country"
- ^ "Data pertain to the Jewish population"
- ^ Peninsular Malaysia
- ^ Based on permanent seats only
- ^ Parliament was dissolved after the 2008 Guinean coup d'état
Categories:- Healthcare quality
- Health policy


Wikimedia Foundation. 2010.