- Life table
-
 2003 US mortality table, Table 1, Page 1
In actuarial science, a life table (also called a mortality table or actuarial table) is a table which shows, for each age, what the probability is that a person of that age will die before his or her next birthday. From this starting point, a number of inferences can be derived.
- the probability of surviving any particular year of age
- remaining life expectancy for people at different ages
Life tables can be constructed using projections of future mortality rates, but more often they are a snapshot of age-specific mortality rates in the recent past, and do not necessarily purport to be projections. For these reasons, the older ages represented in a life table may have a greater chance of not being representative of what lives at these ages may experience in future, as it is predicated on current advances in medicine, public health and safety standards that did not exist in the early years of this cohort.
Life tables are usually constructed separately for men and for women because of their substantially different mortality rates. Other characteristics can also be used to distinguish different risks, such as smoking status, occupation, and socio-economic class.
Life tables can be extended to include other information in addition to mortality, for instance health information to calculate health expectancy. Health expectancies, of which disability-free life expectancy (DFLE) and Healthy Life Years (HLY) are the best-known examples, are the remaining number of years a person can expect to live in a specific health state, such as free of disability. Two types of life tables are used to divide the life expectancy into life spent in various states: 1) multi-state life tables (also known as increment-decrement life tables) based on transition rates in and out of the different states and to death, and 2) prevalence-based life tables (also known as the Sullivan method) based on external information on the proportion in each state. Life tables can also be extended to show life expectancies in different labor force states or marital status states.
Life tables are also used extensively in biology and epidemiology. The concept is also of importance in product life cycle management.
Contents
Insurance applications
In order to price insurance products, and ensure the solvency of insurance companies through adequate reserves, actuaries must develop projections of future insured events (such as death, sickness, and disability). To do this, actuaries develop mathematical models of the rates and timing of the events. They do this by studying the incidence of these events in the recent past, and sometimes developing expectations of how these past events will change over time (for example, whether the progressive reductions in mortality rates in the past will continue) and deriving expected rates of such events in the future, usually based on the age or other relevant characteristics of the population. These are called mortality tables if they show death rates, and morbidity tables if they show various types of sickness or disability rates.
The availability of computers and the proliferation of data gathering about individuals has made possible calculations that are more voluminous and intensive than those used in the past (i.e. they crunch more numbers) and it is more common to attempt to provide different tables for different uses, and to factor in a range of non-traditional behaviors (e.g. gambling, debt load) into specialized calculations utilized by some institutions for evaluating risk. This is particularly the case in non-life insurance (eg the pricing of motor insurance can allow for a large number of risk factors, which requires a correspondingly complex table of expected claim rates). However the expression "life table" normally refers to human survival rates and is not relevant to non-life assurance.
The mathematics
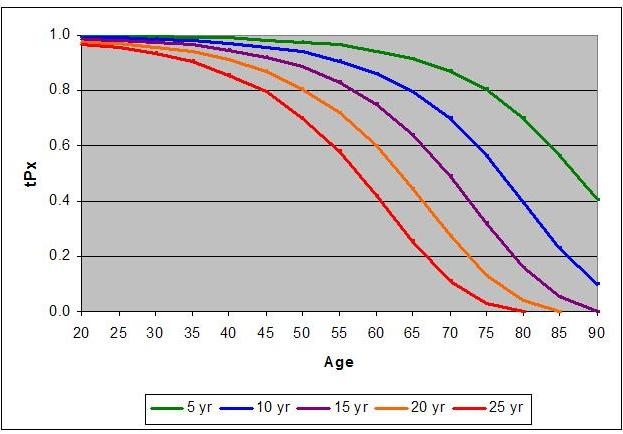
 tpx chart from Table 1. Life table for the total population: United States, 2003, Page 8
The basic algebra used in life tables is as follows.
 : the probability that someone aged exactly
  will die before reaching age
  .
. : the probability that someone aged exactly will survive to age .
 : the number of people who survive to age
-
- note that this is based on a starting point of
 lives, typically taken as 100,000

- note that this is based on a starting point of
 : the number of people who die aged last birthday
 : the probability that someone aged exactly will survive for
  more years, i.e. live up to at least age
  years
years
 : the probability that someone aged exactly will survive for more years, then die within the following
  years
years
- μx : the force of mortality, ie the instantaneous mortality rate at age x, ie the number of people dying in a short interval starting at age x, divided by lx and also divided by the length of the interval. Unlike , the instantaneous mortality rate, μx, may exceed 1.
Another common variable is
This symbol refers to Central rate of mortality. It is approximately equal to the average force of mortality, averaged over the year of age.
Epidemiology
In epidemiology and public health, both standard life tables to calculate life expectancy and Sullivan and multistate life tables to calculate health expectancy are commonly used. The latter include information on health in addition to mortality.
See also
- Age-adjusted life expectancy
- Actuarial present value
- Decrement table
- Gompertz-Makeham law of mortality
- Strategies for Engineered Negligible Senescence
- Survival analysis
Citation
- Shepard, Jon; Robert W. Greene (2003). Sociology and You. Ohio: Glencoe McGraw-Hill. pp. A-22. ISBN 0078285763. http://www.glencoe.com/catalog/index.php/program?c=1675&s=21309&p=4213&parent=4526.
- "Life Expectancies". Office of the State Actuary. 2008-09-22. http://aspe.hhs.gov/POVERTY/papers/relabs.htm. Retrieved 2008 -01-16.
External links
Categories:- Actuarial science
- Demography
- Population
- Statistical data types
- Insurance


Wikimedia Foundation. 2010.