- Arun Council election, 2003
-
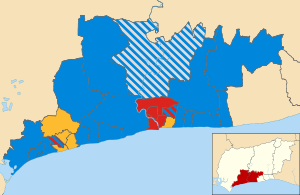 Map of the results of the 2003 Arun council election. Conservatives in blue, Liberal Democrats in yellow, Labour in red and Independent in grey.
The 2003 Arun Council election took place on 1 May 2003 to elect members of Arun District Council in West Sussex, England. The whole council was up for election with boundary changes since the last election in 1999.[1] The Conservative party stayed in overall control of the council.[2]
Contents
Campaign
Before the election the Conservatives ran the council, as they had since it was founded in 1973, with 37 seats, compared to 9 Liberal Democrats, 8 Labour and 2 independent councillors.[3] In total 138 candidates stood for the 56 seats being contested over 27 wards, with the boundaries having been changed since the 1999 election.[3]
Issues in the election included council tax levels, refuse collection, the closure of Arundel Pool, a shortage of low cost homes, crime and anti-social behaviour and plans to devolve power more locally within the council area.[3]
Election result
The results saw the Conservatives stay in control of the council after winning 36 seats, compared to 11 Liberal Democrats, 8 Labour and 1 independent.[4] The leaders of each of the Liberal Democrats, John Richards, Labour, Roger Nash, and independents Bill Redman, were all defeated at the election, with the Labour leader Roger Nash losing by 1 vote in Pevensey ward.[4]
Arun Local Election Result 2003[5][6] Party Seats Gains Losses Net gain/loss Seats % Votes % Votes +/- Conservative 36 0 64.3 52.8 35,106 +2.5% Liberal Democrat 11 +1 19.6 28.3 18,834 +0.8% Labour 8 0 14.3 13.9 9,250 -4.2% Independent 1 -1 1.8 4.4 2,914 +0.3% UKIP 0 0 0 0.6 431 +0.6% Ward results
Aldwick East (2)[4][6] Party Candidate Votes % ±% Conservative Gillian Brown 890 28.8 Conservative Robin Brown 872 28.2 Liberal Democrat William Wolforth 529 17.1 Liberal Democrat Brian Dodd 524 17.0 Labour Michael Neville 154 4.5 Labour Simon Mouatt 125 4.0 Turnout 3,094 39.6 Aldwick West (2)[4][6] Party Candidate Votes % ±% Conservative Frances Coleman 875 34.0 Conservative Jacqueline Maconachie 789 30.1 Liberal Democrat Janet Collier 289 11.2 Liberal Democrat Gary Smith 251 9.7 Labour Raymond Leigh 203 7.9 Labour Leslie Rich 171 6.6 Turnout 2,578 33.3 Angmering (3)[4][6] Party Candidate Votes % ±% Conservative Julie Hazelhurst 886 29.6 Conservative Michael Church 862 28.8 Conservative Oliver Wingrove 733 24.5 Liberal Democrat Margaret Munro 512 17.1 Turnout 2,993 28.0 Arundel (2)[4][6] Party Candidate Votes % ±% Independent Donald Ayling 803 30.6 Conservative Steven Dendle 675 25.7 Independent William Redman 631 24.0 Liberal Democrat Ivan Olney 410 15.6 Labour Peter Slowe 107 4.1 Turnout 2,626 42.3 Barnham (3)[4][6] Party Candidate Votes % ±% Conservative Jean Goad 1,322 25.4 Conservative Anthony Dixon 1,220 23.5 Conservative Richard Wilby 1,185 22.8 Liberal Democrat Ian Menzies 613 11.8 Liberal Democrat Barbara Roberts 442 8.5 Liberal Democrat Alfred Roberts 413 7.9 Turnout 5,195 30.3 Beach (2)[4][6] Party Candidate Votes % ±% Liberal Democrat James Walsh 647 31.0 Liberal Democrat Richard James 558 26.8 Conservative David Hodgson 473 22.7 Labour Andrew McTaggart 211 10.1 Labour Andy Parker 196 9.4 Turnout 2,085 33.0 Bersted (3)[4][6] Party Candidate Votes % ±% Liberal Democrat Simon McDougall 801 22.0 Liberal Democrat Sylvia Olliver 780 21.4 Liberal Democrat Martin Lury 718 19.8 Conservative Eric Pond 375 10.3 Labour Patrick Hastings 364 10.0 Labour Simon Holland 319 8.8 Labour Gail Walker 278 7.6 Turnout 3,635 24.6 Brookfield (2)[4][6] Party Candidate Votes % ±% Conservative Alan Gammon 357 24.4 Labour David Dyball 334 22.8 Labour Mark Thomson 303 20.7 Liberal Democrat Paul Graydon 238 16.2 Liberal Democrat Nicholas Wiltshire 233 15.9 Turnout 1,465 22.0 East Preston with Kingston (3)[4][6] Party Candidate Votes % ±% Conservative Richard Bower 1,374 30.0 Conservative John Rankin 1,345 29.3 Conservative Dennis Wilde 1,308 28.5 Liberal Democrat George Schlich 563 12.3 Turnout 4,590 32.9 Felpham East (2)[4][6] Party Candidate Votes % ±% Conservative Susan Kelly 712 32.0 Conservative Simon Weston 602 27.1 Independent Michael Harvey 571 25.7 Labour Stephen McConnell 172 7.7 Labour Sharon Whitlam 166 7.5 Turnout 2,223 32.8 Felpham West (2)[4][6] Party Candidate Votes % ±% Conservative Alan Stainton 684 27.4 Conservative Elaine Stainton 612 24.5 Independent Mary Harvey 547 22.0 Liberal Democrat Michael Chapman 274 11.0 Liberal Democrat Michelle White 155 6.2 Labour Melanie Webb 121 4.8 Labour Sharon Kingswell 102 4.1 Turnout 2,495 34.8 Ferring (2)[4][6] Party Candidate Votes % ±% Conservative Roger Elkins 1,092 38.1 Conservative David Hill 1,052 36.7 Labour Henry Miller 382 13.3 Liberal Democrat Lyndsey Green 341 11.9 Turnout 2,867 41.9 Findon[4][6] Party Candidate Votes % ±% Conservative Stephen Brookman 564 77.3 Liberal Democrat Kay Schlich 166 22.7 Majority 398 54.6 Turnout 730 37.3 Ham (2)[4][6] Party Candidate Votes % ±% Labour Anthony Squires 375 29.3 Labour Michael Northeast 350 27.3 Conservative Sarah Britton 213 16.6 Liberal Democrat Anchorette Blackstone 179 14.0 Liberal Democrat John Wedderburn 163 12.7 Turnout 1,280 21.0 Hotham (2)[4][6] Party Candidate Votes % ±% Liberal Democrat Jeanette Warr 313 19.1 Liberal Democrat Paul Wells 313 19.1 Conservative Andrew Evans 287 17.5 Conservative Edwin Gyde 270 16.5 Labour Michael Jones 240 14.6 Labour Carole Richmond 217 13.2 Turnout 1,640 23.1 Marine (2)[4][6] Party Candidate Votes % ±% Liberal Democrat Kenneth Scutt 455 23.6 Liberal Democrat Ian Harding 419 21.7 Conservative Douglas Maconachie 388 20.1 Conservative George Blampied 355 18.4 Labour Pauline Nash 158 8.2 Labour Catherine Mouatt 152 7.9 Turnout 1,927 26.8 Middleton-on-Sea (2)[4][6] Party Candidate Votes % ±% Conservative Barbara Oakley 1,008 38.0 Conservative Paul Wotherspoon 874 33.0 Liberal Democrat Roslyn Kissell 358 13.5 Labour Priscilla Matcham 268 10.1 Labour Edward Nattrass 143 5.4 Turnout 2,651 33.8 Orchard (2)[4][6] Party Candidate Votes % ±% Liberal Democrat Francis Oppler 417 26.1 Liberal Democrat David Biss 387 24.2 Labour Jasper Richmond 261 16.4 Labour Alison Sharples 255 16.0 Conservative Jean Pereira 140 8.8 Conservative Martin Pereira 136 8.5 Turnout 1,596 21.1 Pagham and Rose Green (3)[4][6] Party Candidate Votes % ±% Conservative Leonard Brown 918 19.9 Conservative Anita Hall 917 19.9 Conservative Ashvinkumar Patel 913 19.8 Liberal Democrat Sara Allen 406 8.8 Liberal Democrat Jennifer Gillibrand 354 7.7 Liberal Democrat Robert Gillibrand 331 7.2 Labour Anne-Marie Norman 283 6.1 Labour Michael Phillips 252 5.5 Labour Jeremy Tomlinson 236 5.1 Turnout 4,610 27.3 Pevensey (2)[4][6] Party Candidate Votes % ±% Conservative Sandra Daniells 330 20.8 Labour Jan Cosgrove 324 20.4 Labour Roger Nash 323 20.4 Liberal Democrat Kenneth Olliver 311 19.6 Liberal Democrat Vincent McCabe 299 18.8 Turnout 1,587 25.5 River (2)[4][6] Party Candidate Votes % ±% Labour Mark Butler 395 22.4 Labour Wendy Squires 360 20.4 Conservative David Britton 331 18.8 Liberal Democrat Natasha Lear 259 14.7 Independent John Cockrell 235 13.3 Liberal Democrat Mark Winterford 184 10.4 Turnout 1,764 30.5 Rustington East (2)[4][6] Party Candidate Votes % ±% Conservative Philippa Bower 855 33.7 Conservative John Rose 845 33.3 Liberal Democrat Irene Richards 419 16.5 Liberal Democrat Allan Turner 416 16.4 Turnout 2,535 33.8 Rustington West (3)[4][6] Party Candidate Votes % ±% Conservative Raymond Steward 1,009 Conservative Harold Parris 1,005 18.0 Conservative Graham Tyler 974 17.4 Liberal Democrat Val Capon 726 12.9 Liberal Democrat John Ceriog-Hughes 649 11.6 Liberal Democrat John Richards 595 10.6 UKIP Janet Penn 431 7.7 Labour Edward Walsh 222 4.0 Turnout 5,611 33.1 Walberton[4][6] Party Candidate Votes % ±% Conservative Norman Dingemans 646 72.3 Liberal Democrat George Fletcher 248 27.7 Majority 398 44.6 Turnout 894 39.8 Wick with Toddington (2)[4][6] Party Candidate Votes % ±% Labour George O'Neill 373 20.3 Labour Alan Butcher 355 19.3 Conservative Derek Hulmes 344 18.7 Liberal Democrat David Jones 338 18.4 Liberal Democrat Kevin Weller 304 16.5 Independent Lilias Cheyne 127 6.9 Turnout 1,841 29.8 Yapton (2)[4][6] Party Candidate Votes % ±% Conservative John Matthews 752 37.2 Conservative Stephen Haymes 737 36.4 Liberal Democrat Ronald Probert 270 13.3 Liberal Democrat William Robinson 264 13.0 Turnout 2,023 28.0 References
- ^ "Local elections". BBC News Online. http://news.bbc.co.uk/1/shared/bsp/hi/vote2003/locals/html/9.stm. Retrieved 19 May 2011.
- ^ "Election results". Financial Times: p. 8. 3 May 2003.
- ^ a b c "Arun Council". The Argus. 22 April 2003. http://www.theargus.co.uk/archive/2003/04/22/The+Argus+Archive/6737819.Arun_Council/. Retrieved 19 May 2011.
- ^ a b c d e f g h i j k l m n o p q r s t u v w x y z aa ab "Arun District Council: Con hold". The Argus. 2 May 2003. http://www.theargus.co.uk/archive/2003/05/02/Brighton+Hove+Archive/5112014.Arun_District_Council__Con_hold/. Retrieved 19 May 2011.
- ^ "English councils". The Times: p. 47. 3 May 2003.
- ^ a b c d e f g h i j k l m n o p q r s t u v w x y z aa "2003 - District Election Results". Arun District Council. http://www.arun.gov.uk/main.cfm?type=MAY03. Retrieved 19 May 2011.
Preceded by
Arun Council election, 1999Arun local elections Succeeded by
Arun Council election, 2007(2002 ←)  United Kingdom local elections, 2003 (→ 2004)
Metropolitan boroughs Barnsley · Birmingham · Bolton · Bradford · Bury · Calderdale · Coventry · Doncaster · Dudley · Gateshead · Kirklees · Knowsley · Leeds · Liverpool · Manchester · Newcastle upon Tyne · North Tyneside · Oldham · Rochdale · Rotherham · Salford · Sandwell · Sefton · Sheffield · Solihull · South Tyneside · St Helens · Stockport · Sunderland · Tameside · Trafford · Wakefield · Walsall · Wigan · Wirral · WolverhamptonUnitary authorities Bath and North East Somerset · Blackburn with Darwen · Blackpool · Bournemouth · Bracknell Forest · Brighton & Hove · Bristol · Darlington · Derby · East Riding of Yorkshire · Halton · Hartlepool · Herefordshire · Kingston upon Hull · Leicester · Luton · Medway · Middlesbrough · Milton Keynes · North East Lincolnshire · North Lincolnshire · North Somerset · Nottingham · Peterborough · Plymouth · Portsmouth · Reading · Redcar and Cleveland · Rutland · Slough · South Gloucestershire · Southampton · Southend-on-Sea · Stockton-on-Tees · Stoke-on-Trent · Swindon · Telford and Wrekin · Torbay · Warrington · West Berkshire · Windsor and Maidenhead · Wokingham · YorkDistrict councils Adur · Allerdale · Alnwick · Amber Valley · Arun · Ashfield · Ashford · Aylesbury Vale · Babergh · Barrow-in-Furness · Basildon · Basingstoke and Deane · Bassetlaw · Bedford · Berwick-upon-Tweed · Blaby · Blyth Valley · Bolsover · Boston · Braintree · Breckland · Brentwood · Bridgnorth · Broadland · Bromsgrove · Broxbourne · Broxtowe · Burnley · Cambridge · Cannock Chase · Canterbury · Caradon · Carlisle · Carrick · Castle Point · Castle Morpeth · Charnwood · Chelmsford · Cherwell · Chester · Chester-le-Street · Chesterfield · Chichester · Chiltern · Christchurch · Chorley · Colchester · Congleton · Copeland · Corby · Cotswold · Craven · Crawley · Crewe and Nantwich · Dacorum · Dartford · Daventry · Derbyshire Dales · East Hampshire · Eastleigh · Ellesmere Port and Neston · Elmbridge · Epping Forest · Exeter · Fenland · Fylde · Gedling · Gloucester · Gravesham · Great Yarmouth · Harlow · Harrogate · Hart · Havant · Hertsmere · Huntingdonshire · Hyndburn · Ipswich · Macclesfield · Maidstone · Mole Valley · Newcastle-under-Lyme · North Devon · Norwich · Nuneaton and Bedworth · Pendle · Penwith · Preston · Purbeck · Redditch · Reigate and Banstead · Rochford · Rossendale · Rugby · Runnymede · Rushmoor · Shrewsbury and Atcham · South Bedfordshire · South Cambridgeshire · South Lakeland · South Ribble · St Albans · Stevenage · Stratford-on-Avon · Stroud · Swale · Tamworth · Tandridge · Three Rivers · Tonbridge and Malling · Tunbridge Wells · Watford · Waveney · Welwyn Hatfield · West Lancashire · West Lindsey · West Oxfordshire · Weymouth and Portland · Winchester · Woking · Worcester · Worthing · Wyre ForestScottish councils Aberdeen · Aberdeenshire · Angus · Argyll and Bute · Clackmannanshire · Dumfries and Galloway · Dundee City · East Ayrshire · East Dunbartonshire · East Lothian · East Renfrewshire · Edinburgh · Falkirk · Fife · Glasgow · Highland · Inverclyde · Midlothian · Moray · Comhairle nan Eilean Siar · North Ayrshire · North Lanarkshire · Orkney · Perth and Kinross · Renfrewshire · Scottish Borders · Shetland · South Ayrshire · South Lanarkshire · Stirling · West Dunbartonshire · West LothianCategories:- Council elections in West Sussex
- English local elections, 2003
- English District Council elections
- Arun

Wikimedia Foundation. 2010.