- Multitaper
-
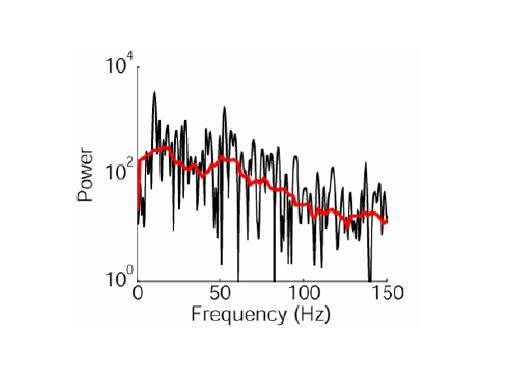
 Comparions of periodogram (black) and multitaper estimate (red) of a single trial local field potential measurement. This estimate used 9 tapers.
In signal processing, the multitaper method is a technique developed by David J. Thomson to estimate the power spectrum SX of a stationary ergodic finite-variance random process X, given a finite contiguous realization of X as data.
Contents
Motivation
The multitaper method overcomes some of the limitations of conventional Fourier analysis. When applying the Fourier transform to extract spectral information from a signal, we assume that each Fourier coefficient is a reliable representation of the amplitude and relative phase of the corresponding component frequency. This assumption, however, is not always valid. For instance, a single trial represents only one noisy realization of the underlying process of interest. A comparable situation arises in statistics when estimating measures of central tendency i.e., it is bad practice to estimate qualities of a population using individuals or very small samples. Likewise, a single sample of a process does not necessarily provide a reliable estimate of its spectral properties. Moreover, the naive power spectral density obtained from the signal's Fourier transform is a biased estimate of the true spectral content.
These problems are often overcome by averaging over many realizations of the same event. However, this method is unreliable with small data sets and undesirable when one does not wish to attenuate signal components that vary across trials. Instead of ensemble averaging, the multitaper method reduces estimation bias by obtaining multiple independent estimates from the same sample. Each data taper is multiplied element-wise by the signal to provide a windowed trial from which one estimates the power at each component frequency. As each taper is pairwise orthogonal to all other tapers, the windowed signals provide statistically independent estimates of the underlying spectrum. The final spectrum is obtained by averaging over all the tapered spectra. Thomson chose as tapers the Slepian or discrete prolate spheroidal sequences since these tapers are mutually orthogonal and possess desirable spectral concentration properties (see the section on Slepian sequences). In practice, a weighted average is often used to compensate for increased energy loss at higher order tapers.
The method
Consider a p-dimensional zero mean stationary stochastic process
Here T denotes the matrix transposition. In neurophysiology for example, p refers to the total number of channels and hence
 can represent simultaneous measurement of electrical activity of those p channels. Let the sampling interval between observations be Δt, so that the Nyquist frequency is fN = 1 / (2Δt).
The multitaper spectral estimator utilizes several different data tapers which are orthogonal to each other. The multitaper cross-spectral estimator between channel l and m is the average of K direct cross-spectral estimators between the same pair of channels (l and m) and hence takes the form
Here,
 (for
(for  ) is the kth direct cross spectral estimator between channel l and m and is given by
where
 The three leading Slepian sequences for T=1000 and 2WT=6. Note that each higher order sequence has an extra zero crossing.
The Slepian sequences
The sequence {ht,k} is the data taper for the kth direct cross-spectral estimator
 and is chosen as follows:
We choose a set of K orthogonal data tapers such that each one provides a good protection against leakage. These are given by the Slepian sequences, after David Slepian (also known in literature as discrete prolate spheroidal sequences or DPSS for short) with parameter W and orders k = 0 to K − 1. The maximum order K is chosen to be less than the Shannon number 2NWΔt. The quantity 2W defines the resolution bandwidth for the Spectral concentration problem and
 . When l = m, we get the multitaper estimator for the auto-spectrum of the lth channel.
Applications of multitaper method
This technique is currently used in the spectral analysis toolkit of Chronux. An extensive treatment about the application of this method to analyze multi-trial, multi-channel data generated in Neuroscience experiments, Biomedical Engineering and others can be found here. Not limited to time series, the multitaper method can be reformulated for spectral estimation on the sphere using spherical harmonics for applications in geophysics and cosmology among others.
References
- Percival, D. B., and A. T. Walden. Spectral Analysis for Physical Applications: Multitaper and Conventional Univariate Techniques. Cambridge: Cambridge University Press, 1993.
- Dahlen, F. A., and F. J. Simons. Spectral estimation on a sphere in geophysics and cosmology. Geophysical Journal International, 2008, doi:10.1111/j.1365-246X.2008.03854.x
- Press, WH; Teukolsky, SA; Vetterling, WT; Flannery, BP (2007), "Section 13.4.3. Multitaper Methods and Slepian Functions", Numerical Recipes: The Art of Scientific Computing (3rd ed.), New York: Cambridge University Press, ISBN 978-0-521-88068-8, http://apps.nrbook.com/empanel/index.html#pg=662
- F. J. Simons, M. A. Wieczorek and F. A. Dahlen. Spatiospectral concentration on a sphere. SIAM Review, 2006, doi:10.1137/S0036144504445765
- Slepian, D. "Prolate spheroidal wave functions, Fourier analysis, and uncertainty – V: The discrete case." Bell System Technical Journal, Volume 57 (1978), 1371–430.
- Thomson, D. J. "Spectrum estimation and harmonic analysis." In Proceedings of the IEEE, Volume 70 (1982), 1055–1096.
- Wieczorek, M. A. and F. J. Simons. Minimum-Variance Multitaper Spectral Estimation on the Sphere. Journal of Fourier Analysis and Applications, 2007, 10.1007/s00041-006-6904-1
See also
External links
Categories:- Frequency domain analysis


Wikimedia Foundation. 2010.