- One-line diagram
-
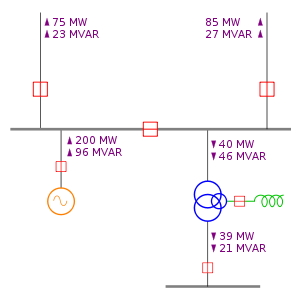 A typical one-line diagram with annotated power flows. Red boxes represent circuit breakers, grey lines represent three-phase bus and interconnecting conductors, the orange circle represents an electric generator, the green spiral is an inductor, and the three overlapping blue circles represent a double-wound transformer with a tertiary winding.
In power engineering, a one-line diagram or single-line diagram is a simplified notation for representing a three-phase power system.[1] The one-line diagram has its largest application in power flow studies. Electrical elements such as circuit breakers, transformers, capacitors, bus bars, and conductors are shown by standardized schematic symbols.[1] Instead of representing each of three phases with a separate line or terminal, only one conductor is represented. It is a form of block diagram graphically depicting the paths for power flow between entities of the system. Elements on the diagram do not represent the physical size or location of the electrical equipment, but it is a common convention to organize the diagram with the same left-to-right, top-to-bottom sequence as the switchgear or other apparatus represented.
The theory of three-phase power systems tells us that as long as the loads on each of the three phases are balanced, we can consider each phase separately.[2] In power engineering, this assumption is usually true (although an important exception is the asymmetric fault), and to consider all three phases requires more effort with very little potential advantage.[3]
A one-line diagram is usually used along with other notational simplifications, such as the per-unit system.
A secondary advantage to using a one-line diagram is that the simpler diagram leaves more space for non-electrical, such as economic, information to be included.
Unbalanced systems
When using the method of symmetrical components, separate one-line diagrams are made for each of the positive, negative and zero-sequence systems. This simplifies the analysis of unbalanced conditions of a polyphase system. Items that have different impedances for the different phase sequences are identified on the diagrams. For example, in general a generator will have different positive and negative sequence impedance, and certain transformer winding connections block zero-sequence currents. The unbalanced system can be resolved into three single line diagrams for each sequence, and interconnected to show how the unbalanced components add in each part of the system.
References
Categories:- Electric power distribution
- Diagrams

Wikimedia Foundation. 2010.