- New South Wales state election, 1935
-
New South Wales state election, 1935 
1932 ← 11 May 1935 → 1938 All 90 seats in the New South Wales Legislative Assembly. First party Second party 

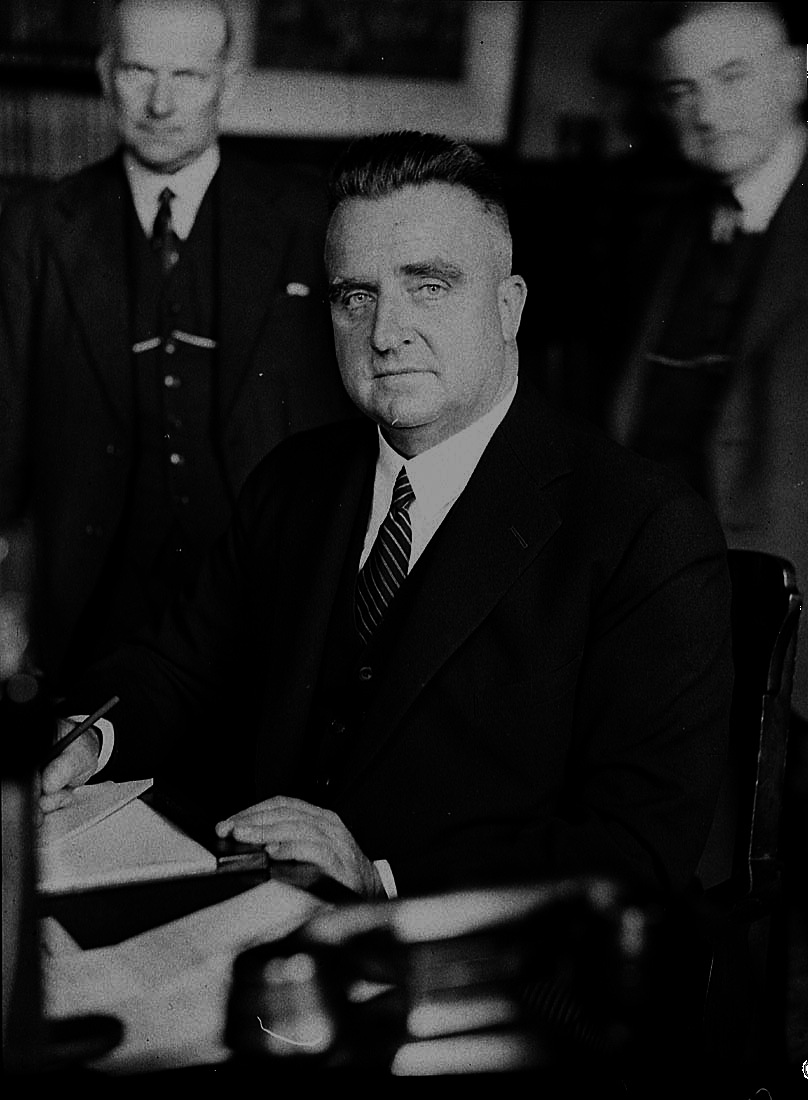
Leader Bertram Stevens Jack Lang Party UAP/Country coalition Labor (NSW) Leader since 5 April 1932 31 July 1923 Leader's seat Croydon Auburn Last election 64 seats 24 seats Seats won 61 seats 29 seats Seat change  3
3 5
5Percentage 46.0% 42.8% Swing 3.82.3
Premier before election
Bertram Stevens
UAP/Country coalitionElected Premier
Bertram Stevens
UAP/Country coalitionThe 1935 New South Wales state election was held on 11 May 1935. This election was for all of the 90 seats in the 31st New South Wales Legislative Assembly and was conducted in single member constituencies with compulsory preferential voting.
The result of the election was:
- United Australia Party 38 seats
- Country Party 23 seats
- Australian Labor Party (NSW) 29 seats.
The UAP/Country Party coalition of Bertram Stevens/Michael Bruxner had a majority of 32 (down 10) and continued in government throughout the term.
The ALP (NSW) and the Federal Executive of the Australian Labor Party were still divided at the 1935 election and the ALP (Federal) ran candidates in 22 seats without success. The parties were re-united in 1936. Jack Lang remained party leader and Leader of the Opposition throughout the term of the parliament.
Contents
Key dates
Date Event 12 April 1935 The Legislative Assembly was dissolved, and writs were issued by the Governor to proceed with an election. 18 April 1935 Nominations for candidates for the election closed at noon. 11 May 1935 Polling day. 10 June 1935 The writs were returned and the results formally declared. 12 June 1935 Opening of 31st Parliament. Results
New South Wales state election, 11 May 1935
Legislative Assembly
<< 1932 — 1938 >>Enrolled Voters 1,347,884[1] Votes Cast 1,255,419 Turnout 96.06 -0.34 Informal Votes 39,333 Informal 3.04 0.83 Summary of votes by party Party Primary Votes % Swing Seats Change Labor (NSW) 532,486 42.42 +2.3 29 + 5 United Australia 415,485 33.10 –3.6 38 – 3 Country 162,178 12.92 –0.2 23 ± 0 Labor 59,694 4.75 +0.5 0 ± 0 All others 85,576 6.81 0 ± 0 Total 1,255,419 90 - 1 There were 1,528,713 enrolled voters but 180,829 were enrolled in 11 electorates (five UAP, four Country and two Labor) which were uncontested at the election.
References
- "Former members of the New South Wales Parliament, 1856-2006". New South Wales Parliament. http://www.parliament.nsw.gov.au/prod/parlment/members.nsf/V3ListFormerMembers. Retrieved 2009-01-11.
- Antony Green. "NSW Elections Analysis". New South Wales Parliament. http://www.parliament.nsw.gov.au/resources/nswelectionsanalysis/HomePage.htm. Retrieved 12 January 2009.
- Nairn, Bede (1995)Jack Lang the 'Big Fella':Jack Lang and the Australian Labor Party 1891-1949
Melbourne University Press Melbourne ISBN 052284700
See also
Members of the New South Wales Legislative Assembly, 1935–1938
 Elections in New South Wales
General
elections1856 · 1858 · 1859 · 1860 · 1864-65 · 1869-70 · 1872 · 1874-75 · 1877 · 1880 · 1882 · 1885 · 1887 · 1889 · 1891 · 1894 · 1895 · 1898 · 1901 · 1904 · 1907 · 1910 · 1913 · 1917 · 1920 · 1922 · 1925 · 1927 · 1930 · 1932 · 1935 · 1938 · 1941 · 1944 · 1947 · 1950 · 1953 · 1956 · 1959 · 1962 · 1965 · 1968 · 1971 · 1973 · 1976 · 1978 · 1981 · 1984 · 1988 · 1991 · 1995 · 1999 · 2003 · 2007 · 2011Categories:- Elections in New South Wales
- 1935 elections in Australia

Wikimedia Foundation. 2010.