- Area chart
-
 Area Chart
 Layered Area Chart
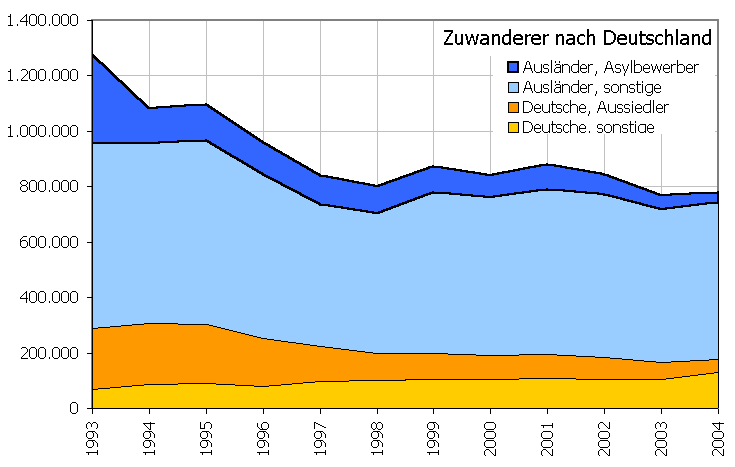
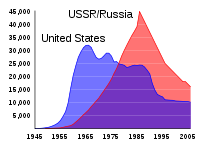
An area chart or area graph displays graphically quantitive data. It is based on the line chart. The area between axis and line are commonly emphasized with colors, textures and hatchings. Commonly one compares with an area chart two or more quantities.
Common uses
Area charts are used to represent cumulated totals using numbers or percentages (stacked area charts in this case) over time.

This statistics-related article is a stub. You can help Wikipedia by expanding it.