- MayaVi
-

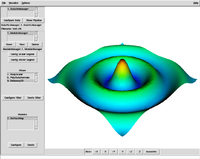
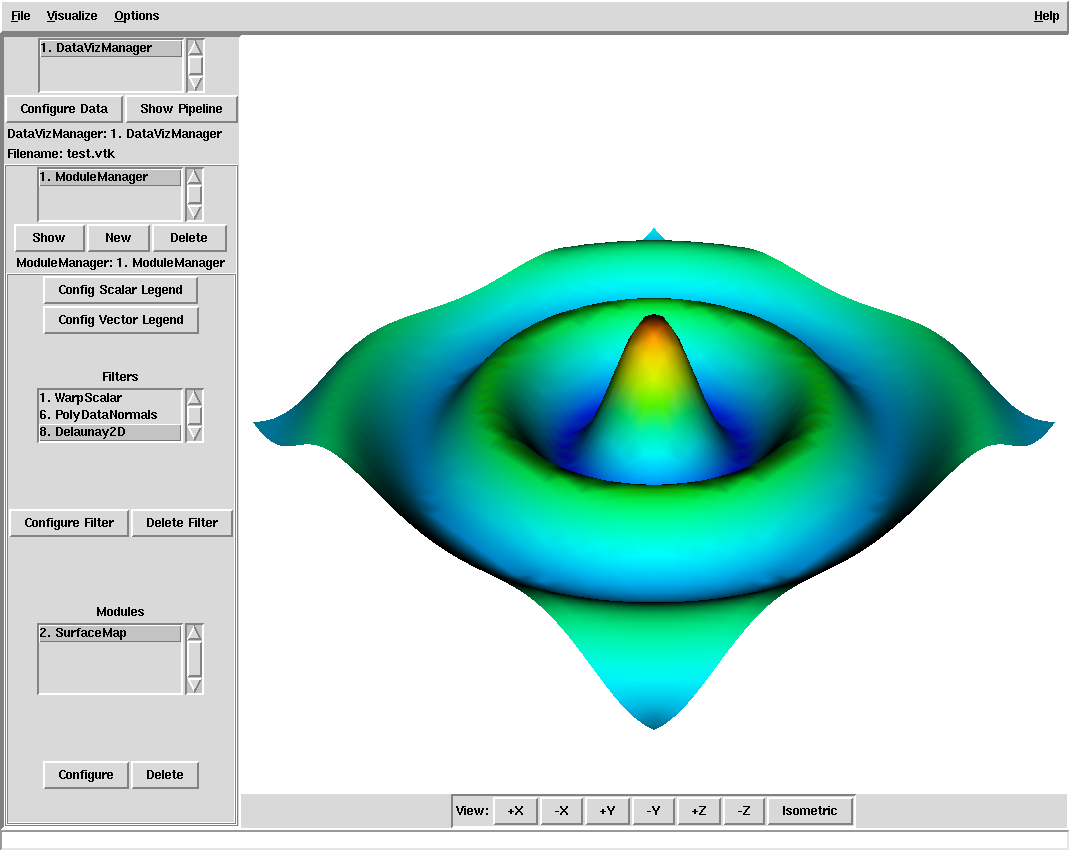
A screenshot of the main window, with an example visualizationOriginal author(s) Prabhu Ramachandran Developer(s) Enthought Initial release 2001 Stable release 1.5 / September 13, 2005 Preview release 4.0.0 / June 22, 2011[1] Development status Active Written in Python, VTK, WxPython/Qt Operating system GNU/Linux, Mac OS X, Microsoft Windows Available in English Type Data Visualizer License BSD Website code.enthought.com/projects/mayavi/ MayaVi is a scientific data visualizer written in Python, which uses VTK and provides a GUI via Tkinter. MayaVi was developed by Dr. Prabhu Ramachandran, is free and distributed under the BSD license. It is cross-platform and runs on any platform where both Python and VTK are available (almost any Unix, Mac OS X, or Windows). MayaVi is pronounced as a single name, "Ma-ya-vee", meaning "magician" in Sanskrit. The code of MayaVi has nothing in common with that of Autodesk Maya or Vi.[2]
The latest version of MayaVi, called Mayavi2, is a component of the Enthought suite of scientific Python programs. It differs from the original MayaVi by its strong focus on making not only an interactive program, but also a reusable component for 3D plotting in Python. Although it exposes a slightly different interface and API than the original MayaVi, it is now more feature-rich.[3][4]
Major features
- visualizes computational grids and scalar, vector, and tensor data
- an easy-to-use GUI
- can be imported as a Python module from other Python programs or can be scripted from the Python interpreter
- supports volume visualization of data via texture and ray cast mappers
- support for any VTK dataset using the VTK data format
- support for PLOT3D data
- multiple datasets can be used simultaneously
- provides a pipeline browser, with which objects in the VTK pipeline can be browsed and edited
- imports simple VRML and 3D Studio scenes
- custom modules and data filters can be added
- exporting to PostScript files, PPM/BMP/TIFF/JPEG/PNG images, Open Inventor, Geomview OOGL, VRML files, Wavefront .obj files, or RenderMan RIB file
References
External Links
Categories:- Free plotting software
- Free software programmed in Python
- Plotting software
- Free data visualization software
Wikimedia Foundation. 2010.