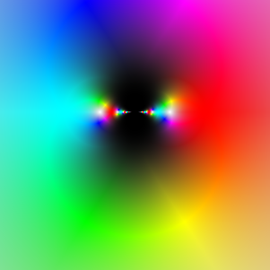
- Color wheel graphs of complex functions
-
In mathematics, complex function is a function with the complex numbers as both its domain and codomain. The complex color wheel method assigns a color to the Gauss number plane unequivocally. The assignment could be diverse, but usually one of the following two:
- the origin is white, 1 is red, −1 is lightblue, and a point at the infinity is black,
or
- the origin is black, 1 is red, −1 is lightblue, and a point at the infinity is white.
In both assignments, vivid colors of the rainbow are rotating in a continuous way on the complex unit circle, so the 6th roots of unity (counted from the 0th, the 1) are: red, yellow, green, lightblue, darkblue, violet. In addition, it is common in the assignments that the gradiations of colors belonging to two complex numbers close to each other are close to each other, and that colors of complex numbers of the same argument are gradiations of the same color – the one which has greater absolute value is darker (according to the first definition) or lighter (according to the second definition).
History
The color wheel method was probably first used in publication by Larry Crone in 1987.[citation needed]
Outer references
Categories:
Wikimedia Foundation. 2010.

