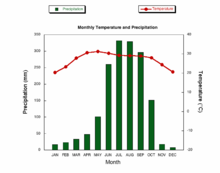
- Climograph
-
A climograph is a graphical representation of the basic climatic parameters, that is monthly average temperature and precipitation, at a certain location. It is used for a quick-view of the climate of a location.
External links
Climographs are a combination of a bar and line chart used to show the climate of a place over a 12 month period.
Categories:- Climate
- Atmospheric science stubs
Wikimedia Foundation. 2010.

