- Mansfield (UK Parliament constituency)
-
Mansfield County constituency for the House of Commons 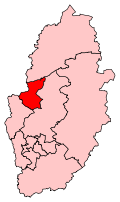
Boundary of Mansfield in Nottinghamshire.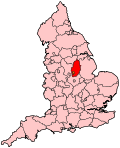
Location of Nottinghamshire within England.County Nottinghamshire Electorate 79,849 (December 2010)[1] Major settlements Mansfield Current constituency Created 1885 Member of Parliament Alan Meale (Labour) Number of members One Created from North Nottinghamshire Overlaps European Parliament constituency East Midlands Mansfield is a county constituency represented in the House of Commons of the Parliament of the United Kingdom. It elects one Member of Parliament (MP) by the first past the post system of election.
Contents
Boundaries
The constituency covers the town of Mansfield in Nottinghamshire.
Boundary review
Following their review of parliamentary boundaries in Nottinghamshire, the Boundary Commission for England has made only minor changes to the existing constituencies to allow for population changes. The boundaries of the modified constituency to be fought at the 2010 general election will be co-terminous with the District of Mansfield.
History
A constituency with a coal mining tradition, Mansfield has been held by the Labour Party for generations. It has usually been regarded as a safe seat for them, however in the general elections of the 1980s they came close to losing to the Conservative Party. At the 1983 election, they held the seat by just over 2,000 votes. However, at the 1987 election their majority was just 56. That election was set against the background of the Miners Strike of 1984, which was not supported by the majority of miners in Nottinghamshire.
In the elections after 1987, the Labour MP Alan Meale has held the seat with comfortable majorities. At the 2005 general election, Mansfield was notable for the Independent candidate Stewart Rickersey, an Independent member of Mansfield District Council, receiving 17% of the vote and finishing in third place.
Members of Parliament
Election Member [2] Party 1885 Cecil George Savile Foljambe Liberal 1892 John Carvell Williams Liberal 1900 Arthur Basil Markham[3] Liberal 1916 by-election Sir Charles Seely, Bt. Liberal 1918 William Carter Labour 1922 Albert James Bennett Liberal 1923 Frank Bradley Varley Labour 1929 Charles Brown Labour 1941 by-election Bernard Taylor Labour 1966 Don Concannon Labour 1987 Alan Meale Labour Elections
Elections in the 2010s
General Election 2010: Mansfield[4] Party Candidate Votes % ±% Labour Alan Meale 18,753 38.7 -11.4 Conservative Tracy Critchlow 12,741 26.3 +7.6 Liberal Democrat Michael Wyatt[5] 7,469 15.4 +1.4 Mansfield Independent Forum Andre Camilleri 4,339 9.0 +9.0 UKIP David Hamilton 2,985 6.2 +6.2 BNP Rachel Hill 2,108 4.4 +4.4 Majority 6,012 12.4 Turnout 48,395 60.4 +3.5 Labour hold Swing -9.5 Elections in the 2000s
General Election 2005: Mansfield Party Candidate Votes % ±% Labour Alan Meale 18,400 48.1 −9.0 Conservative Anne Wright 7,035 18.4 −8.8 Independent Stewart Rickersey 6,491 17.0 N/A Liberal Democrat Roger Shelley 5,316 13.9 −1.8 Veritas Michael Harvey 1,034 2.7 N/A Majority 11,365 29.7 Turnout 38,276 55.4 +0.2 Labour hold Swing −0.1 General Election 2001: Mansfield Party Candidate Votes % ±% Labour Alan Meale 21,050 57.1 -7.3 Conservative William Wellesley 10,012 27.2 +6.0 Liberal Democrat Tim Hill 5,790 15.7 +4.7 Majority 11,038 29.9 Turnout 36,852 55.2 -15.5 Labour hold Swing Elections in the 1990s
General Election 1997: Mansfield Party Candidate Votes % ±% Labour Alan Meale 30,556 64.4 Conservative Tim Frost 10,038 21.2 Liberal Democrat Phil Smith 5,244 11.1 Referendum Party J. Bogusz 1,588 3.3 Majority 20,518 43.3 Turnout 70.7 Labour hold Swing General Election 1992: Mansfield[6] Party Candidate Votes % ±% Labour Alan Meale 29,932 54.4 +16.9 Conservative GS Mond 18,208 33.1 −4.3 Liberal Democrat SR Thompstone 6,925 12.6 −9.6 Majority 11,724 21.3 +21.2 Turnout 55,065 82.2 +3.8 Labour hold Swing +10.6 Elections in the 1980s
General Election 1987: Mansfield Party Candidate Votes % ±% Labour Alan Meale 19,610 37.5 Conservative Charles Hendry 19,554 37.4 Social Democrat Barry Answer 11,604 22.2 Moderate Labour Brian Marshall 1,580 3.0 Majority 56 0.1 Turnout 78.4 Labour hold Swing General Election 1983: Mansfield Party Candidate Votes % ±% Labour Don Concannon 18,670 40.5 Conservative R.J. Wrenn 16,454 35.6 Social Democrat S.E. Taylor 11,036 23.9 Majority 2,216 4.9 Turnout 46,160 70.7 Labour hold Swing Notes and references
- ^ "Electorate Figures - Boundary Commission for England". 2011 Electorate Figures. Boundary Commission for England. 4 March 2011. http://www.boundarycommissionforengland.org.uk/electoral-figures/electoral-figures.htm. Retrieved 13 March 2011.
- ^ Leigh Rayment's Historical List of MPs – Constituencies beginning with "M" (part 1)
- ^ "Sir Arthur Basil Markham" Encyclopædia Britannica, 1911, accessed 22 August 2008
- ^ Mansfield UK Polling
- ^ "Michael Wyatt". Liberal Democrats. http://www.libdems.org.uk/people_detail.aspx?name=Michael_Wyatt. Retrieved 5 April 2010.
- ^ "Politics Resources". Election 1992. Politics Resources. 9 April 1992. http://www.politicsresources.net/area/uk/ge92/ge92index.htm. Retrieved 2010-12-06.
See also
Constituencies in the East Midlands (46) Conservative (31) Amber Valley · Boston and Skegness · Bosworth · Broxtowe · Charnwood · Corby · Daventry · Derbyshire Dales · Erewash · Gainsborough · Grantham and Stamford · Harborough · High Peak · Kettering · Lincoln · Loughborough · Louth and Horncastle · Mid Derbyshire · Newark · Northampton North · Northampton South · North West Leicestershire · Rushcliffe · Rutland and Melton · Sherwood · Sleaford and North Hykeham · South Derbyshire · South Holland and The Deepings · South Leicestershire · South Northamptonshire · Wellingborough
Labour (15) Ashfield · Bassetlaw · Bolsover · Chesterfield · Derby North · Derby South · Gedling · Leicester East · Leicester South · Leicester West · Mansfield · North East Derbyshire · Nottingham East · Nottingham North · Nottingham South
East Midlands European constituency: Conservative (2) · Labour (1) · UKIP (1) · Liberal Democrats (1) Categories:- Parliamentary constituencies in Nottinghamshire
- United Kingdom Parliamentary constituencies established in 1885
- Mansfield


Wikimedia Foundation. 2010.