- Demographics of Budapest
-
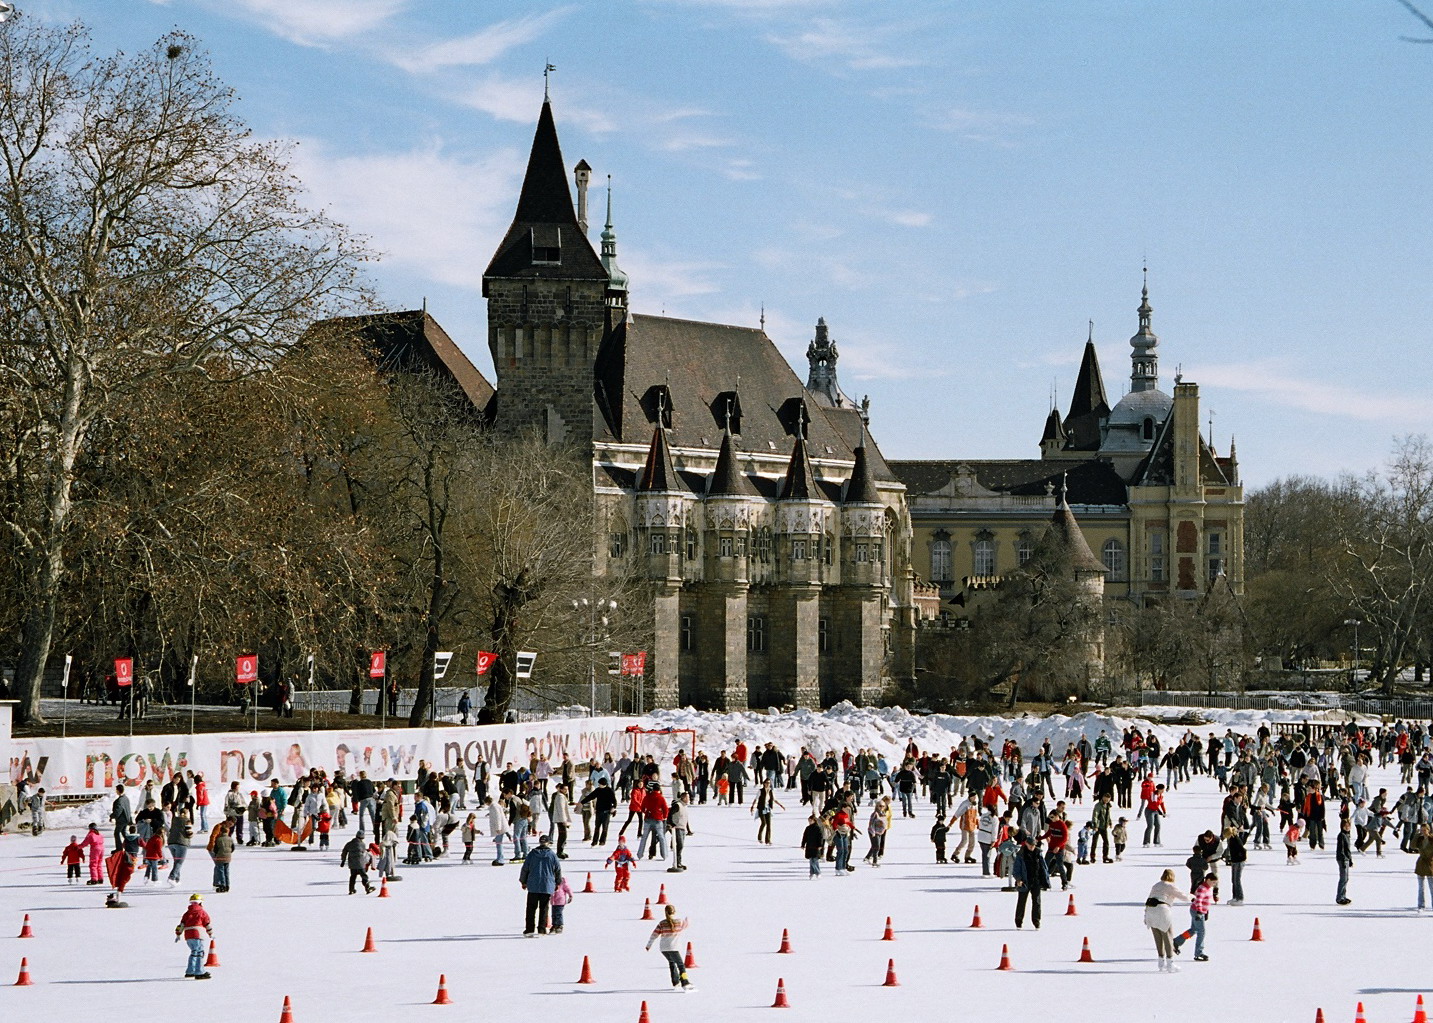
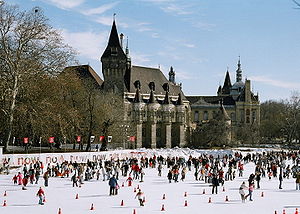 Ice skaters in front of Vajdahunyad Castle in Budapest
According to the official gazetteer of 2011, there are 1,733,685 people and 895,400 households (dwellings) in Budapest Capital, Hungary.[1] In 2011 the official Budapest metropolitan area has 2,551,247 inhabitants and in the official Budapest commuter area (established by the government in 2005[2]) lived 3,271,110 people (2009)[3], so the Hungarian metropolis is the largest metropolitan area in Central-East Europe and the primate city of the Pannonian Basin (former Greater Hungary).[4]
Contents
Population of Budapest in 2001
Nationalities
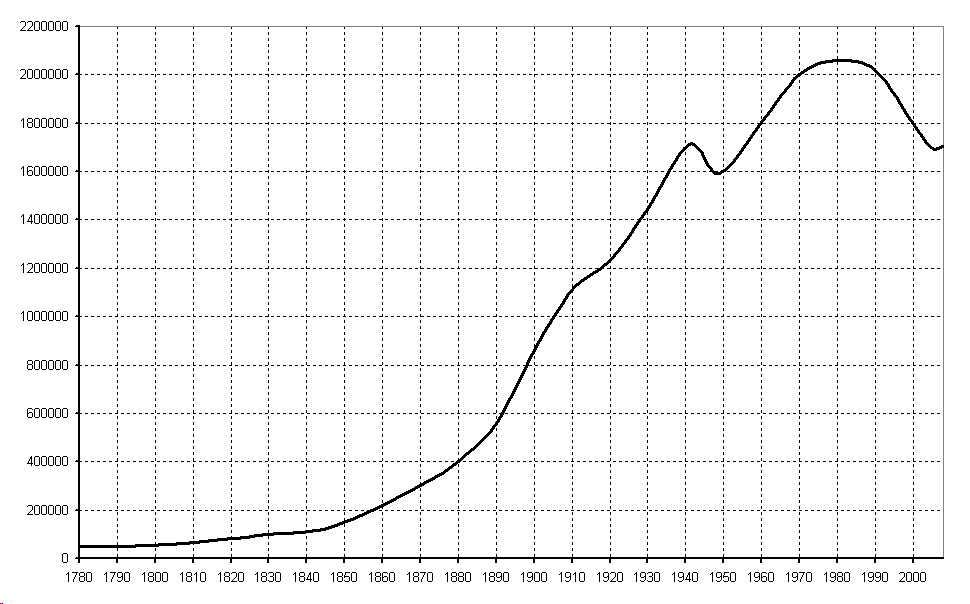
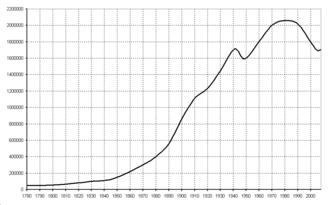 Population change of Budapest (1780-2008)
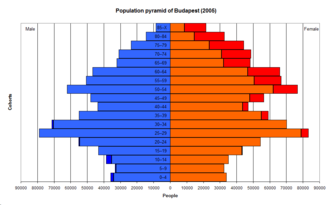 Population pyramid of Budapest (2005)
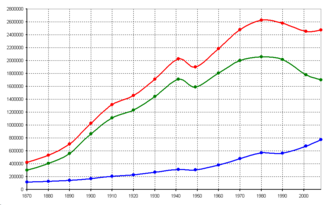 Population change of Budapest metropolitan area (1870-2008, red: Budapest metropolitan area, green: Budapest Capital, blue: Budapest suburban area)
Nationalities Size Note Magyars 1,631,043 (91.2%) - Germans 18,097 (1%) Danube Swabians Roma 14,019 (0.8%) Generality of them are Hungarian speaking Romungro[6] Slovaks 4,929 (0.3%) - Greeks 3,410 - Romanians 2,637 - Chinese 2,289 - Ukrainians 2,055 - Poles 2,044 - Others 4,327 - No answer, unknown 93,071 - Population by spoken language
Language Size Note Hungarian 1,766,733 (99.4%) Mother tongue English 393,642 (22.1%) Foreign language German 286,351 (16.1%) Foreign and minority language[9] Russian 68,960 (3.9%) Foreign language French 57,648 (3.2%) Foreign language Religions
Denomination Size Note Roman Catholic 808,460 (45.5%) Mainly Magyar and German descendants Calvinist 224,169 (12.6%) Only Magyar descendants Lutheran 46,449 (2.6%) Magyar, German and Slovak descendants Greek Catholic 28,901 (1.6%) Magyar descendants Jewish 9,468 (0.5%) Generality of them are Magyarized Neolog Jews Other Christian 20,523 - Others 5,971 - Atheist 374,209 (21%) - No answer, unknown 286,584 - Historical population
Population by spoken language (1715-2001)
Language 1715 1737 1750 1851 1880 1890 1900 1910 1920 1930 1941 2001 Hungarian 19,4% 22,5% 22,2% 36,6% 56,7% 67,1% 79,6% 85,9% 90,2% 94,3% 97% 99.4% German 55,6% 57,8% 55,2% 56,4% 34,3% 23,7% 14% 9% 6,5% 3,8% 1,9% - Slovak 2,2% 5,6% 6,5% 5% 6,1% 5,6% 3,4% 2,3% 1,5% 0,7% 0,3% - Other 22,8%[14] 14,1% 16,1% 2% 2,9% 3,6% 3% 2,8% 1,8% 1,2% 0,8% 0.6% Factory workers by nationality in Budapest (1877)
Nationality Share Magyars 46.6% Foreigners[16] 25% Slovaks 22.2% Serbs 0.9% Romanians 0.3% Others 5% Population by denominations (1870-1949)
Denomination 1870 1880 1890 1900 1910 1920 1930 1941 1949 Roman Catholic 72,3% 67,4% 64,7% 60,7% 59,8% 59,1% 60,7% 63,7% 71,3% Calvinist 4,8% 6,1% 7,4% 8,9% 9,9% 10,9% 12,1% 13,6% 15,5% Lutheran 5,3% 5,5% 5,6% 5,3% 5% 4,8% 5% 5,3% 5,4% Jewish 16,6% 19,7% 21% 23,6% 23,1% 23,2% 20,3% 15,8% 6,4% Others 1% 1,3% 1,3% 1,5% 2,2% 2% 1,9% 1,6% 1,4% Historical population data
Buda and Pest
Year Buda Pest Budapest 1720 9 600 2 600 12 200 1787 24 873 22 417 47 290 1799 24 306 29 870 54 176 1813 34 066 36 153 70 219 1848 40 500 110 516 151 016 1851 50 127 127 935 178 062 1869 70 000 200 476 280 349 1873 69 573 227 294 296 867 Budapest Capital
Year Population 1870 302,085 
1880 402,706 1890 560,079 1900 861,434 1910 1,110,453 1920 1,232,026 1930 1,442,869 1941 1,712,791 Year Population 1949 1,590,316 
1960 1,804,606 1970 2,001,083 1980 2,059,226 1990 2,016,681 2001 1,777,921 2005 1,695,814 2011 1,733,685 Budapest metropolitan area
Year Population 1870 418,490 1880 530,556 1890 703,004 1900 1,027,626 1910 1,315,183 1920 1,459,449 1930 1,712,596 1941 2,025,402 Year Population 1949 1,897,882 1960 2,184,255 1970 2,480,325 1980 2,626,702 1990 2,579,440 2001 2,454,150 2005 2,421,831 2011 2,551,247 Budapest suburban area
Year Population 1870 116,404 1880 127,850 1890 142,925 1900 166,192 1910 204,730 1920 227,423 1930 269,727 1941 312,611 Year Population 1949 307,566 1960 379,649 1970 479,242 1980 567,476 1990 562,759 2001 676,229 2005 724,488 2011 817,562 See also
- Demographics of Hungary
- Budapest
- Greater Budapest
- Budapest metropolitan area
- Magyarization
- Neolog Judaism
- Judapest
References
- ^ Official gazetteer of Hungary, 2011
- ^ History of the Budapest Commuter Association (English)
- ^ Settlements of the Budapest Commuter Area
- ^ Tuna Tasan-Kok: Budapest, Istanbul and Warsaw: Institutional and spatial change, p.41 "...other Hungarian cities remained predominantly agricultural. Budapest continued to grow as the primate city."
- ^ 2001 census (English)
- ^ Romungro means "Hungarian Roma"
- ^ Hungarian census 2001 (English)
- ^ Hungarian census 2001 (English)
- ^ German is historically spoken is Budapest, because until the 1870s Budapest was a German-language city.
- ^ 2001 census (English)
- ^ Budapest statisztikai évkönyve 1943 (Statistical Yearbook of Budapest, 1943), p. 33, Hungarian Central Statistical Office
- ^ A Pallas nagy lexikona
- ^ Detailed population statistics of Budapest (2001 census)
- ^ Mainly Serbo-Croatian
- ^ Ethnic composition, assimilation in Hungary
- ^ Mainly Germans and Czechs from Austria and the Czech lands
- ^ Budapest székes főváros Statisztikai és Közigazgatási Évkönyve 1921-1924 (Statistical Yearbook of Budapest, 1921-1924), p. 38, Hungarian Central Statistical Office
- ^ Budapest statisztikai évkönyve 1943 (Statistical Yearbook of Budapest, 1943), p. 32, Hungarian Central Statistical Office
- ^ Budapest statisztikai évkönyve 1944-1946 (Statistical Yearbook of Budapest, 1944-1946), p. 12, Hungarian Central Statistical Office
Categories:- Demographics of Budapest
- Hungarian society
- Budapest
- History of Budapest
- People from Budapest
- Hungarian people by period
- Hungarian people by ethnic or national origin
- Hungarian people by religion
- Demographics by city
- Hungarian history stubs


Wikimedia Foundation. 2010.