- Population Growth of Munich
-
 Coat of arms
This article contains the Population Growth of Munich via tables and graphs.
Contents
Population Growth
 Population Growth
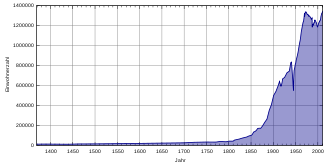
The population of Munich was only 24,000 in 1700, but it doubled every 30 years, and in 1852 the population exceeded 100,000, qualifying it a big city (Großstadt) by German administrative standards. By 1883, Munich had a population of 250,000; this doubled to 500,000 in 1901, making Munich the third largest city in the Deutsches Reich after Berlin and Hamburg.
The physical effects of the Second World War are clearly visible. Towards the end of the war, 90% of the historical old town had been destroyed in 73 aerial raids and half of the city was in ruins. Estimates for the impact of these raids on the population offer the figure of 6,000 dead. In total, Munich lost 34% of its population, with 279,000 people displaced through evacuation, migration, deportation, and made homeless through aerial attacks. The total population decreased from 829,000 in May 1939 to 550,000 in May 1945. The prewar population level was not regained until 1950.
Shortly before the city's 800th anniversary, on 15 December 1957, the millionth resident of Munich was born, making Munich the latest city to reach a population of one million out of 70 cities worldwide.[clarification needed] According to the Bavarian National Office for Statistics and Data Processing, the official figure for the population of Munich was 1,259,677 in December 2005 (only principal residences and with adjustments from other national offices). As of June 2007[update], it stood at 1,305,525.
The following summary shows the population according to historical local data. Up to 1824 the figures are mainly estimates; after that they are census results or official statistics from the local authorities. From 1871 onward, the figures given refer to the "population present in the town (ortsanwesende Bevölkerung); from 1925 the figures are the "resident population" (Wohnbevölkerung), and from since 1987 the figures are for the "population at the place of main residence" (Bevölkerung am Ort der Hauptwohnung). Before 1871, figures are from irregular survey methods.
From 1369 to 1944
Date Inhabitants 1369 10,810 1396 11,267 1440 9,488 1462 12,614 1500 13,447 1600 18,000 1630 20,000 1700 24,000 1722 29,097 1750 32,000 1771 31,000 1781 37,840 1794 34,277 1801 40,450 1810 40,638 1813 51,396 Date Inhabitants 1824 62,290 1. June 1830 71,375 ¹ 3 December 1840 82.736 ¹ 3 December 1843 90.055 ¹ 3 December 1846 94,830 ¹ 3 December 1849 96,398 ¹ 3 December 1852 106,715 ¹ 3 December 1855 132,112 ¹ 3 December 1858 137,095 ¹ 3 December 1861 148,201 ¹ 3 December 1864 167,054 ¹ 3 December 1867 170,688 ¹ 1 December 1871 169,693 ¹ 1 December 1875 193,024 ¹ 1 December 1880 230,023 ¹ 1 December 1885 261,981 ¹ Date Inhabitants 1 December 1890 349,024 ¹ 2 December 1895 407,307 ¹ 1 December 1900 499,959 ¹ 1 December 1905 509,067 ¹ 1 December 1910 596,467 ¹ 31 December 1913 640,000 1 December 1916 594,096 ¹ 5 December 1917 595.002 ¹ 8 October 1919 630,711 ¹ 31 December 1920 666,000 16 June 1925 680,704 ¹ 31 December 1930 728,900 16 June 1933 735,388 ¹ 31 December 1935 743,653 17 May 1939 829,318 ¹ 31 December 1940 834,500 ¹ Census figures
From 1945 to 1989
Date Inhabitants 8 May 1945 550,000 31 December 1945 674,154 29 October 1946 751,967 ¹ 31 December 1947 788,100 31 December 1948 801,500 30 June 1949 814,228 30 June 1950 823,892 13 September 1950 831,937 ¹ 30 June 1951 855,003 30. June 1952 873,065 30. June 1953 889,843 30. June 1954 908,572 30 June 1955 929,808 30 June 1956 957,177 25 September 1956 962,860 ¹ 30 June 1957 986,028 30 June 1958 1,011,878 Date Inhabitants 30 June 1959 1,033,854 30 June 1960 1,055,457 6 June 1961 1,085,014 ¹ 31 December 1961 1,106,298 31 December 1962 1,142,622 31 December 1963 1,166,160 31 December 1964 1,192,614 31 December 1965 1,214,603 31 December 1966 1,235,548 31 December 1967 1,244,237 31 December 1968 1,279,405 31 December 1969 1,326,331 27 May 1970 1,293,590 ¹ 31 December 1970 1,311,978 31 December 1971 1,338,432 31 December 1972 1,338,924 31 December 1973 1,336,576 Date Inhabitants 31 December 1974 1,323,434 31 December 1975 1,314,865 31 December 1976 1,314,572 31 December 1977 1,313,939 31 December 1978 1,296,970 31 December 1979 1,299,693 31 December 1980 1,298,941 31 December 1981 1,291,828 31 December 1982 1,287,080 31 December 1983 1,283,457 31 December 1984 1,267,451 31 December 1985 1,266,549 31 December 1986 1,274,716 25 May 1987 1,185,421 ¹ 31 December 1987 1,201,479 31 December 1988 1,211,617 31 December 1989 1,206,683 ¹ Census figures
From 1990
Date Inhabitants 31 December 1990 1,229,026 31 December 1991 1,229,052 31 December 1992 1,256,638 31 December 1993 1,255,623 31 December 1994 1,244,676 31 December 1995 1,236,370 Date Inhabitants 31 December 1996 1,225,809 31 December 1997 1,205,923 31 December 1998 1,188,897 31 December 1999 1,194,560 31 December 2000 1,210,223 31 December 2001 1,227,958 Date Inhabitants 31 December 2002 1,234,692 31 December 2003 1,247,873 31 December 2004 1,249,176 31 December 2005 1,259,677 31 December 2006 1,294,608 30 September 2007 1,305,525 ¹ Census figures
Source: Bavarian Regional Authority for Statistics and Data Handling (Bayerisches Landesamt für Statistik und Datenverarbeitung).
Population Forecast
The Bertelsmann Foundation provides data for population and population growth for 2,959 municipalities in Germany (January 2006 publication). In Munich, the population is forecast to rise by 7.8% between 2003 and 2020 (96,988 persons).
Projected population growth 2003-2020 for Munich (principal residences):
Date Inhabitants 31 December 2010 1,314,947 31 December 2015 1,340,514 31 December 2020 1,344,861 Source: Bertelsmann Foundation
In the city administration's 2002 planning forecast, a 2% rise of the legally resident[clarification needed] population (principal and secondary residences) between 2001 and 2015 is predicted. For immigration, a 7.2% rise is predicted and for stagnation[clarification needed], a decrease of 1.7%. Absolute population trend 2001-2015 - Forecast for Munich (principal and secondary residences):
Year Planning
forecastProjected
Immigration[clarification needed]Projected
Stagnation[clarification needed]31 December 2001 1,404,000 1,404.000 1,404,000 31 December 2005 1,421,000 1,447.000 1,405,000 31 December 2010 1,421,000 1,486.000 1,386,000 31 December 2015 1,432,000 1,505.000 1,380,000 Source: Munich Statistical Office (Statistisches Amt der Landeshauptstadt München).
Population Structure
In December 2005, the proportion of foreigners was 23.3% or 300,129 persons in absolute figures. The largest groups of these are Turks (43.309), Croatians (24,866), Serbians (24,439), Greeks (22,486), Austrians (21,411) and Italians (20,847). 37% of foreigners in Munich come from countries within the European Union.
Population As of 31 December 2005 Legitimate Population 1,436,725 of which male 707,047 female 729,678 Inhabitants with principal residence 1,288,307 of which male 623,920 female 664,387 Inhabitants with secondary residence 148,418 of which male 83,127 female 65,291 Germans with principal residence 988,178 of which male 466,400 female 521,778 Foreigners with principal residence 300,129 of which male 157,520 female 142,609 Foreigner proportion in % 23.3 Source: Munich Statistical Office (Statistisches Amt der Landeshauptstadt München).
Age Distribution
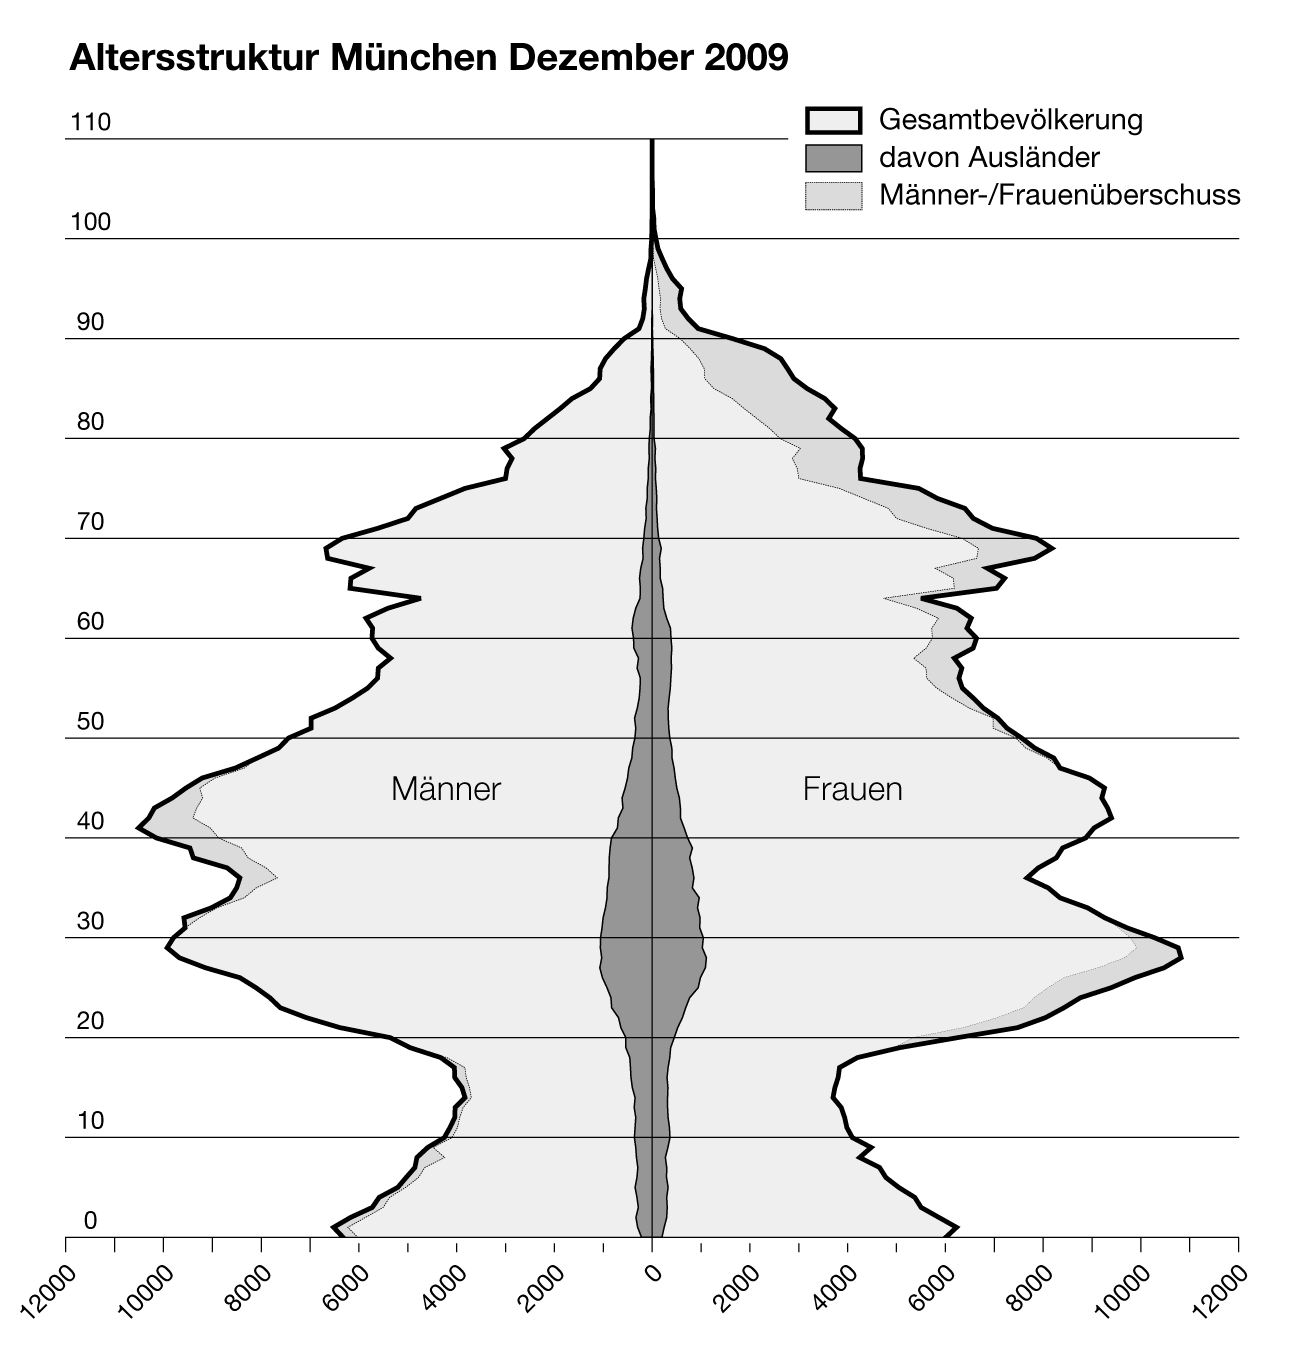
 Population pyramid - Age Distribution 2010
The following shows the age distribution from the 31st December 2005 (principal residences).
Age from - to Inhabitant Count Proportion in % 0 - 5 68,853 5.3 6 - 14 88,518 6.9 15 - 44 575,131 44.6 45 - 64 330,516 25.7 over 65 225,289 17.5 Total 1,288,307 100.0 Source: Munich Statistical Office (Statistisches Amt der Landeshauptstadt München).
Boroughs
The following number of inhabitants refer to principal residences as of the 31 December 2006.
Name Area in km² Inhabitant Count Inhabitants per km² Allach-Untermenzing 15.45 27,730 1,795 Altstadt-Lehel 3.16 18,876 5,973 Aubing-Lochhausen-Langwied 34.06 37,857 1,111 Au-Haidhausen 4.22 54,382 12,887 Berg am Laim 6.31 39,009 6,182 Bogenhausen 23.71 75,657 3,191 Feldmoching-Hasenbergl 28.71 54,245 1,889 Hadern 9.23 44,993 4,875 Laim 5.29 50,082 9,457 Ludwigsvorstadt-Isarvorstadt 4.39 45,736 10,418 Maxvorstadt 4.29 46,058 10,736 Milbertshofen-Am Hart 13.37 66,992 5,011 Moosach 11.09 47,754 4,306 Neuhausen-Nymphenburg 12.92 84,604 6,548 Obergiesing 5.71 47,007 8,232 Pasing-Obermenzing 16.50 63,763 3,864 Ramersdorf-Perlach 19.90 102,689 5,160 Schwabing-Freimann 25.67 62,430 2,432 Schwabing-West 4.37 59,553 13,628 Schwanthalerhöhe 2.07 26,103 12,610 Sendling 3.94 37,146 9,428 Sendling-Westpark 7.81 50,903 6,518 Thalkirchen-Obersendling
-Forstenried-Fürstenried-Solln17.75 80,701 4,547 Trudering-Riem 22.45 53,915 2,401 Untergiesing-Harlaching 8.06 48,075 5,965 Munich 310.43 1,326,206 4,272 Source: Munich Statistical Office (Statistisches Amt der Landeshauptstadt München).[1] (German)
See also
- History of Munich
- Mayors of Munich
- Demographics of Berlin
- Demographics of Cologne
- Demographics of Hamburg
Literature
- Kaiserliches Statistisches Amt (Hrsg.): Statistisches Jahrbuch für das Deutsche Reich, 1880-1918 (German)
- Statistisches Reichsamt (Hrsg.): Statistisches Jahrbuch für das Deutsche Reich, 1919-1941/42 (German)
- Deutscher Städtetag (Hrsg.): Statistisches Jahrbuch Deutscher Gemeinden , 1890 ff. (German)
- Statistisches Bundesamt (Hrsg.): Statistisches Jahrbuch für die Bundesrepublik Deutschland, 1952 ff. (German)
Data Sources
Categories:- History of Munich
- Demographics of Germany
- Demographics by city


Wikimedia Foundation. 2010.