- Eye chart
__NOTOC__Infobox Laboratory equipment
name = Eye chart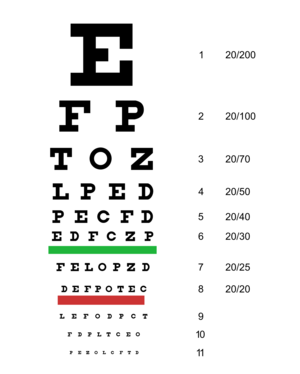
caption = TypicalSnellen chart used forvisual acuity testing.
acronym =
other_names =
uses = Vision testing
inventor =
manufacturer =
model =
related =Snellen chart Landolt C Lea test Tibetan eye chart An eye chart is a chart used to measurevisual acuity . Types of eye charts include theSnellen chart ,Landolt C , and theLea test .Procedure
Charts usually display several rows of
optotype s (test symbols), each row in a different size. The person is asked to identify the numbers or letters on the chart, usually starting with large rows and continuing to smaller rows until the optotypes cannot be reliably identified anymore.Technically speaking, testing visual acuity with an eye chart is a psychophysical measurement that attempts to determine a
sensory threshold (see also "psychometric function ").Variations
Charts are available for very young children or illiterate adults that do not require letter recognition. One version uses simple pictures or patterns. Others are printed with the block letter "E" turned in different orientations, the so called [http://pediatrics.about.com/cs/pediatricadvice/a/vision_scrning_2.htm Tumbling E] . The patient simply indicates which direction each "E" is facing. The
Landolt C chart is similar: rows have circles with different segments missing, and the test-taker describes where each broken piece is located. The last two kinds of charts also reduce the possibility of patient guessing the images.Alternatives
Computer-based semi-automatic alternatives to the eye chart have been developed (e.g. [http://www.augen.uniklinik-freiburg.de/mit/bach/fract_universal/index.html] ), but are not very common. They have several potential advantages, such as a more precise measurement and less examiner-induced bias. Some of them are also well suited for children since they resemble a
video game .

Wikimedia Foundation. 2010.