- Norwegian parliamentary election, 2001
-
Norwegian Parliamentary election, 2001 
1997 ←
membersSeptember 10, 2001 → 2005 All 169 seats to the Norwegian Parliament
85 seats were needed for a majorityFirst party Second party Third party 

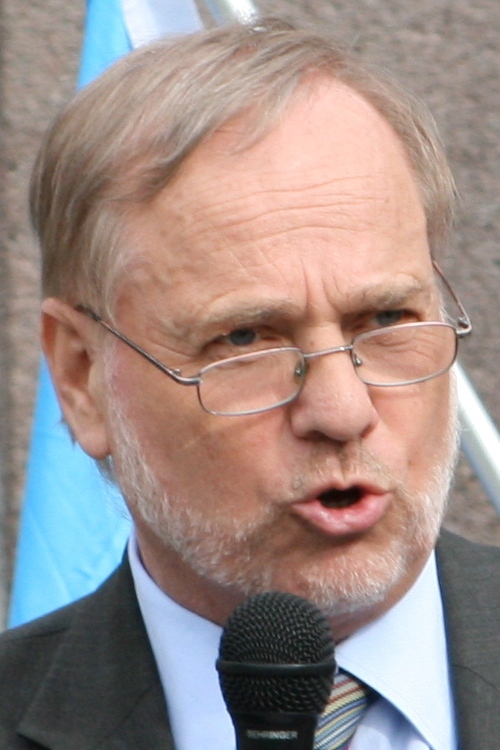
Leader Thorbjørn Jagland Jan Petersen Carl I. Hagen Party Labour Party Conservative Party Progress Party Leader since 1992 1994 1978 Last election 65 seats (35.0%) 23 seats (14.3%) 25 seats (15.3%) Seats won 43 38 26 Seat change -22 +15 +1 Popular vote 612,632 534,852 369,236 Percentage 24.3% 21.2% 14.6%
Prime Minister before election
Jens Stoltenberg
Stoltenberg's First CabinetPrime Minister-designate
Kjell Magne Bondevik
Bondevik's Second CabinetNorway 
This article is part of the series:
Politics and government of
NorwayMonarchyGovernmentParliamentLocal Gov'tForeign policy
A general election to the Storting, the parliament of Norway, was held on September 10, 2001. The Labour Party won a plurality of votes and seats, closely followed by the Conservative Party. The Labour Party was unable to form a government, and a centre-right coalition of the Conservative Party, the Christian People's Party and Liberal Party was formed, led by Prime Minister Kjell Magne Bondevik of the Christian Democratic Party, with confidence and supply support from the Progress Party (Norway).
Contents
Polls
Polls are indicated by share of votes in percentage, or by seats indicated by brackets. The Progress Party saw the most surprising changes in support, having achieved as high as 34.7% in September 2000, and in 2001 almost closing down to 10% at the lowest. The Labour Party and Conservative Party also varied greatly in support in the years before the election.
Polling Firm Date Source Ap H FrP KrF SV Sp V RV Kp Others MMI 2000-05 [1] 38.8% 12.3% 16.7% 13.0% 7.7% 4.9% 3.5% 1.7% n/a 1.5% MMI 2000-06-10 [2] 32.8% 17.9% 19.4% 12.8% 6.7% 5.8% 2.9% 0.8% n/a 1.0% Nationen 2000-07 [3] 29.2% 14.4% 23.2% 13.5% 8.3% 6.9% 2.3% n/a n/a n/a Norsk Gallup 2000-08 [4] 29.0% 19.0% 22.5% 11.0% 8.5% 6.5% 2.5% 2.5% n/a n/a Opinion 2000-08-25 [5] 27.2% 15.4% 22.5% 11.8% 9.9% n/a 4.5% n/a n/a n/a Nationen 2000-08-30 [6] 22.1% 14.9% 24.8% 16.4% 7.8% 6.6% 3.5% n/a n/a n/a Norsk Gallup 2000-09-05 [7] 24.0% 17.5% 28.0% 12.0% 9.0% 6.0% 3.0% 2.0% n/a n/a AC Nielsen 2000-09-29 [8] 25.5% 10.6% 34.7% 10.8% 8.0% 4.9% 3.3% n/a n/a n/a Opinion 2000-10-13 [9] 22.7% 16.0% 29.8% 12.8% n/a 4.4% 2.7% n/a n/a n/a Norsk Gallup 2000-11 [10] 24.5% 17.0% 27.0% 11.5% 10.0% 5.0% 3.5% n/a n/a n/a Norsk Gallup 2000-12-05 [11] 27.5% 17.5% 23.5% 13.0% 7.5% 5.5% 2.5% n/a n/a n/a Din Mening/Norsk Statistikk 2001-02 [12] 30.6% 17.8% 18.5% 13.0% 7.1% 7.1% 3.4% 1.3% n/a n/a Norsk Gallup 2001-03 [13] 29.0% 22.0% 17.5% 9.0% 10.0% 5.5% 3.5% n/a n/a 1.5% Din Mening/Norsk Statistikk 2001-03-27 [14] 30.4% 18.4% 13.7% 14.4% 9.7% 7.6% 3.8% 1.5% n/a n/a Norsk Gallup 2001-04-06 [15] 31.0% 20.5% 11.0% 13.5% 10.0% 5.0% 4.0% n/a n/a 3.5% MMI 2001-06 [16] 24.0% 30.9% 14.0% 12.7% 7.7% 6.2% 1.9% 1.0% n/a 1.7% MMI 2001-08-16 [17] 26.4% 26.6% 14.2% 13.2% 8.9% 5.0% 2.9% 0.9% n/a 1.8% Norsk Gallup 2001-09-04 [18] 26.5% 23.5% 12.0% 11.0% 14.0% 6.0% 2.5% n/a (2) n/a MMI 2001-09-07 [19] 26.2% 22.9% 14.0% 11.7% 12.0% 4.7% 3.8% 1.1% n/a 3.5% AC Nielsen Norge 2001-09-07 [20] 24.9% 21.7% 13.5% 14.8% 12.2% 5.0% 3.4% 1.2% n/a 3.3% Norsk Gallup 2001-09-07 [21] 25.5% 25.5% 11.5% 11.0% 15% 4.5% 2.5% n/a n/a n/a Results
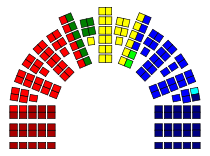 Distribution of mandates after the 2001 Norwegian parliamentary election:
Summary of the 10 September 2001 Norwegian Storting election results Parties Votes Seats # % ± % # ± Norwegian Labour Party (Det norske Arbeiderparti) 612,632 24.3 –10.7 43 –22 Conservative Party (Høyre) 534,852 21.2 +6.9 38 +15 Progress Party (Fremskrittspartiet) 369,236 14.6 –0.7 26 +1 Socialist Left Party (Sosialistisk Venstreparti) 316,456 12.5 +6.5 23 +14 Christian Democratic Party (Kristelig Folkeparti) 312,839 12.4 –1.3 22 –3 Centre Party (Senterpartiet) 140,287 5.6 –2.4 10 –1 Liberal Party (Venstre) 98,486 3.9 –0.6 2 –4 Coastal Party (Kystpartiet) 44,010 1.7 +1.5 1 0 Red Electoral Alliance (Rød Valgallianse) 30,015 1.2 –0.5 0 0 The Political Party (Det Politiske Parti) 19,457 0.8 – 0 – Pensioners' Party (Pensjonistpartiet) 17,940 0.7 +0.1 0 0 Christian Unity Party (Kristent Samlingsparti) 6,731 0.3 – 0 – Environment Party The Greens (Miljøpartiet De Grønne) 3,785 0.2 0.0 0 0 Fatherland Party (Fedrelandspartiet) 2,353 0.1 0.0 0 0 Communist Party of Norway (Norges Kommunistiske Parti) 1,726 0.1 0.0 0 0 Norwegian People's Party (Norsk Folkeparti) 1,609 0.1 – 0 – Non-Partisan Coastal and Rural District Party
(Tverrpolitisk kyst- og distriktsparti)1,052 0.0 – 0 – Sami People Party (Sámeálbmot bellodat, Samefolkets Parti) 564 0.0 – 0 – Social Democrats (Sosialdemokratene) 351 0.0 – 0 – Natural Law Party (Naturlovpartiet) 269 0.0 –0.1 0 0 Liberal People's Party (Det Liberale Folkeparti) 166 0.0 0.0 0 0 Justice Party (Rettferdighetspartiet) 138 0.0 0.0 0 0 Society Party (Samfunnspartiet) 66 0.0 0.0 0 0 County lists 4,026 0.2 – 0 Other lists 2,840 0.1 – 0 – Total 2,521,781 165 Notes
Further reading
- Madeley, John T. S. (April 2002). "Outside the Whale: Norway's Storting Election of 10 September 2001". West European Politics 25 (2): 212–222. doi:10.1080/713869592.
External links
- Storting Election 2001 - Labour's worst election in 77 years from Statistics Norway
- Detailed results (in Norwegian)
- Results by district from Adam Carr's Election Archive
 Elections and referendums in Norway
Parliamentary elections Eidsvoll 1814 · 1814 · 1815 · 1817 · 1820 · 1823 · 1826 · 1829 · 1832 · 1835 · 1838 · 1841 · 1844 · 1847 · 1850 · 1853 · 1856 · 1859 · 1862 · 1865 · 1868 · 1870 · 1873 · 1876 · 1879 · 1882 · 1885 · 1888 · 1891 · 1894 · 1897 · 1900 · 1903 · 1906 · 1909 · 1912 · 1915 · 1918 · 1921 · 1924 · 1927 · 1930 · 1933 · 1936 · 1945 · 1949 · 1953 · 1957 · 1961 · 1965 · 1969 · 1973 · 1977 · 1981 · 1985 · 1989 · 1993 · 1997 · 2001 · 2005 · 2009 · 2013Local elections Sami elections Referendums Categories:- Elections in Norway
- 2001 elections in Europe
- 2001 in Norway


Wikimedia Foundation. 2010.