- New Mexico's 2nd congressional district
-
"NM-2" redirects here. NM-2 may also refer to New Mexico State Road 2.
New Mexico's 2nd congressional district 
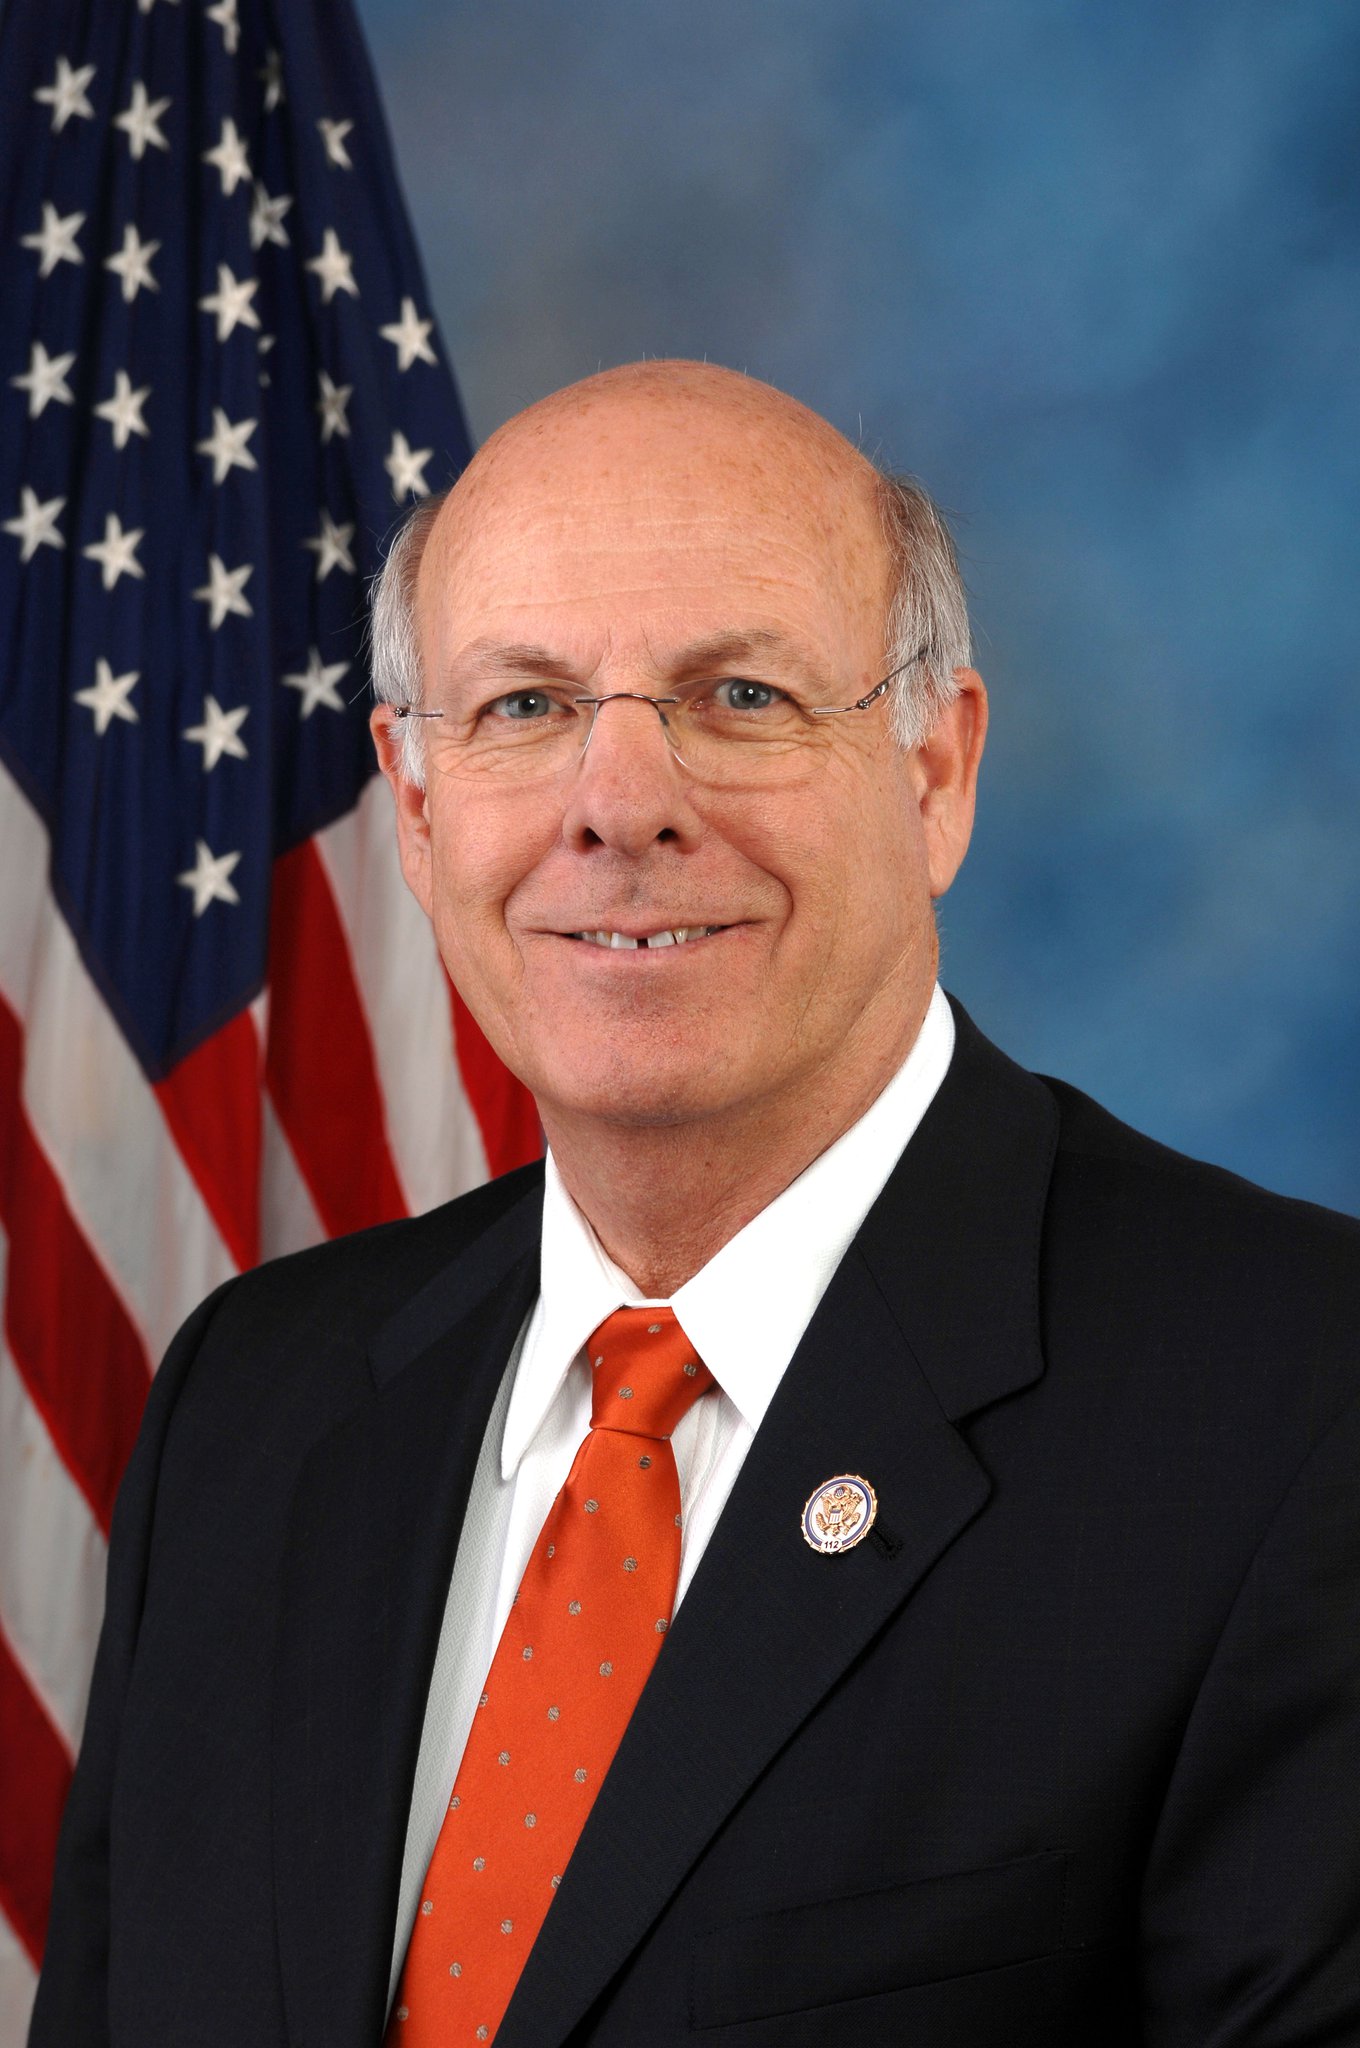
Current Representative Steve Pearce (R–Hobbs) Distribution 70.82% urban, 29.18% rural Population (2000) 606,406 Median income $29,269 Ethnicity 68.8% White, 2.6% Black, 0.6% Asian, 47.3% Hispanic, 5.5% Native American, 1.0% other Cook PVI R+6 New Mexico's second congressional district to the United States House of Representatives serves the southern half of New Mexico, including Las Cruces and Roswell. Geographically, it is the sixth largest district in the nation, and the 2nd-largest not to comprise an entire state (after Nevada's 2nd district). It is currently represented by Republican Steve Pearce who has held the seat since 2011.
Contents
Voting
Election results from presidential races[1]
Year Office Result 2000 President Bush 54 - 43% 2004 President Bush 58 - 41% 2008 President McCain 50 - 49% List of representatives
District borders are periodically redrawn and some District residences may no longer be in the District.
Representative Party Years Congress District Home Electoral history District created January 3, 1969 Districts were created from the former at-large district Ed Foreman Republican January 3, 1969 –
January 3, 197191st Portales Elected in 1968
Lost re-electionHarold L. Runnels Democratic January 3, 1971 –
August 5, 198092nd Lovington First elected in 1970
Died93rd 94th 95th 96th Vacant August 5, 1980 –
January 3, 198196th  Joe Skeen
Republican January 3, 1981 –
January 3, 200397th Roswell First elected in 1980
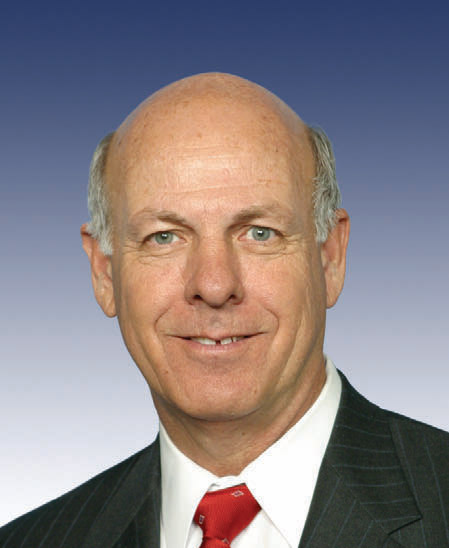
Retired98th 99th 100th 101st 102nd 103rd 104th 105th 106th 107th  Steve Pearce
Republican January 3, 2003 –
January 3, 2009108th Hobbs First elected in 2002
Retired to run for U.S. Senate109th 110th 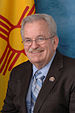 Harry Teague
Democratic January 3, 2009 –
January 3, 2011111th Hobbs Elected in 2008
Lost re-election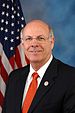 Steve Pearce
Republican January 3, 2011 –
Present112th Hobbs Re-elected in 2010 Election results
1968 • 1970 • 1972 • 1974 • 1976 • 1978 • 1980 • 1982 • 1984 • 1986 • 1988 • 1990 • 1992 • 1994 • 1996 • 1998 • 2000 • 2002 • 2004 • 2006 • 2008 • 2010
1968
United States House of Representatives elections, 1968: New Mexico District 2[2] Party Candidate Votes Percentage Republican Ed Foreman 71,857 50.48% Democratic E. S. Johnny Walker 69,858 49.08% Independent Wilfredo Sedillo 633 0.44% Totals 142,348 100.0% Republican win (new seat) 1970
United States House of Representatives elections, 1970[3] Party Candidate Votes Percentage Democratic Harold L. Runnels 64,518 51.37% Republican Ed Foreman (incumbent) 61,074 48.63% Totals 125,592 100.0% Democratic gain from Republican 1972
United States House of Representatives elections, 1972[4] Party Candidate Votes Percentage Democratic Harold L. Runnels (incumbent) 116,152 72.17% Republican George E. Presson 44,784 27.83% Totals 160,936 100.0% Democratic hold 1974
United States House of Representatives elections, 1974[5] Party Candidate Votes Percentage Democratic Harold L. Runnels (incumbent) 90,127 66.74% Republican Donald W. Trubey 43,045 31.88% American Independent Herbert Horton 1,860 1.38% Totals 135,032 100.0% Democratic hold 1976
United States House of Representatives elections, 1976[6] Party Candidate Votes Percentage Democratic Harold L. Runnels (incumbent) 123,563 70.33% Republican Donald W. Trubey 52,131 29.67% Totals 175,694 100.0% Democratic hold 1978
United States House of Representatives elections, 1978[7] Party Candidate Votes Percentage Democratic Harold L. Runnels (incumbent) 95,710 100.00% Totals 95,710 100.0% Democratic hold 1980
United States House of Representatives elections, 1980: New Mexico District 2[8] Party Candidate Votes Percentage Republican Joe Skeen (as a write-in) 61,564 38.00% Democratic David King 55,085 34.00% Independent Dorothy Runnels (as a write-in) 45,343 28.00% Totals 161,992 100.0% Republican gain from Democratic 1982
United States House of Representatives elections, 1982[9] Party Candidate Votes Percentage Republican Joe Skeen (incumbent) 71,021 58.40% Democratic Caleb Chandler 50,599 41.60% Totals 121,620 100.0% Republican hold 1984
United States House of Representatives elections, 1984[10] Party Candidate Votes Percentage Republican Joe Skeen (incumbent) 116,006 74.33% Democratic Peter R. York 40,063 25.67% Totals 156,069 100.0% Republican hold 1986
United States House of Representatives elections, 1986[11] Party Candidate Votes Percentage Republican Joe Skeen (incumbent) 77,787 62.88% Democratic Mike Runnels 45,924 37.12% Totals 123,711 100.0% Republican hold 1988
United States House of Representatives elections, 1988[12] Party Candidate Votes Percentage Republican Joe Skeen (incumbent) 100,324 100.00% Totals 100,324 100.0% Republican hold 1990
United States House of Representatives elections, 1990[13] Party Candidate Votes Percentage Republican Joe Skeen (incumbent) 80,677 100.00% Totals 80,677 100.0% Republican hold 1992
United States House of Representatives elections, 1992[14] Party Candidate Votes Percentage Republican Joe Skeen (incumbent) 94,838 56.39% Democratic Dan Sosa, Jr. 73,157 43.50% Write-in 175 0.11% Totals 168,170 100.0% Republican hold 1994
United States House of Representatives elections, 1994[15] Party Candidate Votes Percentage Republican Joe Skeen (incumbent) 89,966 63.28% Democratic Benjamin Anthony Chavez 45,316 31.87% Green Rex R. Johnson 6,898 4.85% Totals 142,180 100.0% Republican hold 1996
United States House of Representatives elections, 1996: New Mexico District 2[16] Party Candidate Votes Percentage Republican Joe Skeen (incumbent) 95,091 55.93% Democratic E. Shirley Baca 74,915 44.07% Totals 170,006 100.0% Republican hold 1998
United States House of Representatives elections, 1998: New Mexico District 2[17] Party Candidate Votes Percentage Republican Joe Skeen (incumbent) 85,077 57.93% Democratic E. Shirley Baca 61,796 42.07% Totals 146,873 100.0% Republican hold 2000
United States House of Representatives elections, 2000: New Mexico District 2[18] Party Candidate Votes Percentage Republican Joe Skeen (incumbent) 100,742 58.11% Democratic Michael A. Montoya 72,614 41.89% Totals 173,356 100.0% Republican hold 2002
United States House of Representatives elections, 2002: New Mexico District 2[19] Party Candidate Votes Percentage Republican Steve Pearce 79,631 56.23% Democratic John Arthur Smith 61,916 43.72% Green George L. Dewey (as a write-in) 43 0.03% Republican Padraig M. Lynch (as a write-in) 39 0.02% Totals 141,629 100.0% Republican hold 2004
United States House of Representatives elections, 2004: New Mexico District 2[20] Party Candidate Votes Percentage Republican Steve Pearce (incumbent) 130,498 60.20% Democratic Gary King 86,292 39.80% Totals 216,790 100.0% Republican hold 2006
United States House of Representatives elections, 2006: New Mexico District 2[21] Party Candidate Votes Percentage Republican Steve Pearce (incumbent) 92,620 59.42% Democratic Albert Kissling 63,119 40.49% Democratic C. Dean Burk (as a write-in) 135 0.09% Totals 155,874 100.0% Republican hold 2008
United States House of Representatives elections, 2008: New Mexico District 2[22] Party Candidate Votes Percentage Democratic Harry Teague 129,572 55.96% Republican Edward R. Tinsley 101,980 44.04% Totals 231,552 100.0% Democratic gain from Republican 2010
United States House of Representatives elections, 2010: New Mexico District 2[23] Party Candidate Votes Percentage Republican Steve Pearce 94,053 55.40% Democratic Harry Teague (incumbent) 75,709 44.60% Totals 169,762 100.0% Republican gain from Democratic References
- Martis, Kenneth C. (1989). The Historical Atlas of Political Parties in the United States Congress. New York: Macmillan Publishing Company.
- Martis, Kenneth C. (1982). The Historical Atlas of United States Congressional Districts. New York: Macmillan Publishing Company.
- Congressional Biographical Directory of the United States 1774–present
- ^ Presidential Election Results, by district, swingstateproject.com
- ^ 1968 Election Results
- ^ 1970 Election Results
- ^ 1972 Election Results
- ^ 1974 Election Results
- ^ 1976 Election Results
- ^ 1978 Election Results
- ^ 1980 Election Results
- ^ 1982 Election Results
- ^ 1984 Election Results
- ^ 1986 Election Results
- ^ 1988 Election Results
- ^ 1990 Election Results
- ^ 1992 Election Results
- ^ 1994 Election Results
- ^ 1996 Election Results
- ^ 1998 Election Results
- ^ 2000 Election Results
- ^ 2002 Election Results
- ^ 2004 Election Results
- ^ 2006 Election Results
- ^ 2008 Election Results
- ^ 2010 Election Results
New Mexico's congressional districts All districts: Territory At-large 1 2 3
The At-large district is obsolete
See also: New Mexico's past & present Representatives, Senators, and Delegations, 2010 elections, 2012 elections
All U.S. districts – Apportionment – Redistricting – Gerrymandering – MapsCategories:- Congressional districts of New Mexico


Wikimedia Foundation. 2010.