- Sample maximum and minimum
-
In statistics, the maximum' and sample minimum, also called the largest observation, and smallest observation, are the values of the greatest and least elements of a sample.
The minimum and the maximum value are the first and last order statistics, often denoted X(1) and X(n), respectively, for a sample size of n., easily obtained by sorting in the order of increasing value.
If there are outliers, they necessarily include the sample maximum or sample minimum, or both, depending on whether they are extremely high or low. However, the sample maximum and minimum need not be outliers, if they are not unusually far from other observations.
Contents
Robustness
The sample maximum and minimum are the least robust statistics: they are maximally sensitive to outliers.
This can either be an advantage or a drawback: if extreme values are real (not measurement errors), and of real consequence, as in applications of extreme value theory such as building dikes or financial loss, then outliers (as reflected in sample extrema) are important. On the other hand, if outliers have little or no impact on actual outcomes, then using non-robust statistics such as the sample extrema simply cloud the statistics, and robust alternatives should be used, such as other quantiles: the 10th and 90th percentiles (first and last decile) are more robust alternatives.
Derived statistics
Other than being a component of every statistic that uses all samples, the sample extrema are important parts of the range, a measure of dispersion, and mid-range, a measure of location. They also realize the maximum absolute deviation: they are the furthest points from any given point, particularly a measure of center such as the median or mean.
Applications
Summary statistics
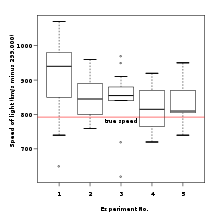
Firstly, the sample maximum and minimum are basic summary statistics, showing the most extreme observations, and are used in the five-number summary and seven-number summary and the associated box plot.
Prediction interval
For more details on this topic, see Prediction interval#Non-parametric.The sample maximum and minimum provide a non-parametric prediction interval: in a sample set from a population, or more generally an exchangeable sequence of random variables, each sample is equally likely to be the maximum or minimum.
Thus if one has a sample set
 and one picks another sample Xn + 1, then this has 1 / (n + 1) probability of being the largest value seen so far, 1 / (n + 1) probability of being the smallest value seen so far, and thus the other (n − 1) / (n + 1) of the time, Xn + 1 falls between the sample maximum and sample minimum of
  Thus, denoting the sample maximum and minimum by M and m, this yields an (n − 1) / (n + 1) prediction interval of [m,M].
For example, if n=19, then [m,M] gives an 18/20 = 90% prediction interval – 90% of the time, the 20th observation falls between the smallest and largest observation seen heretofore. Likewise, n=39 gives a 95% prediction interval, and n=199 gives a 99% prediction interval.
Estimation
Due to their sensitivity to outliers, the sample extrema cannot reliably be used as estimators unless data is clean – robust alternatives include the first and last deciles.
However, with clean data or in theoretical settings, they can sometimes prove very good estimators, particularly for platykurtic distributions, where for small data sets the mid-range is the most efficient estimator.
They are inefficient estimators of location for mesokurtic distributions, such as the normal distribution, and leptokurtic distributions, however.
Uniform distribution
For more details on this topic, see German tank problem.For sampling without replacement from a uniform distribution with one or two unknown endpoints (so
 with N unknown, or
  with both M and N unknown), the sample maximum, or respectively the sample maximum and sample minimum, are sufficient and complete statistics for the unknown endpoints; thus an unbiased estimator derived from these will be UMVU estimator.
If only the top endpoint is unknown, the sample maximum is a biased estimator for the population maximum, but the unbiased estimator
 (where m is the sample maximum and k is the sample size) is the UMVU estimator; see German tank problem for details.
If both endpoints are unknown, then the sample range is a biased estimator for the population range, but correcting as for maximum above yields the UMVU estimator.
If both endpoints are unknown, then the mid-range is an unbiased (and hence UMVU) estimator of the mid-point of the interval (here equivalently the population median, average, or mid-range).
The reason the sample extrema are sufficient statistics is that the conditional distribution of the non-extreme samples is just the distribution for the uniform interval between the sample maximum and minimum – once the endpoints are fixed, the values of the interior points add no additional information.
Normality testing
See also: Normality test Sample extrema can be used for normality testing, as events beyond the 3σ range are very rare.
The sample extrema can be used for a simple normality test, specifically of kurtosis: one computes the t-statistic of the sample maximum and minimum (subtracts sample mean and divides by the sample standard deviation), and if they are unusually large for the sample size (as per the three sigma rule and table therein, or more precisely a Student's t-distribution), then the kurtosis of the sample distribution deviates significantly from that of the normal distribution.
For instance, a daily process should expect a 3σ event once per year (of calendar days; once every year and a half of business days), while a 4σ event happens on average every 40 years of calendar days, 60 years of business days (once in a lifetime), 5σ events happen every 5,000 years (once in recorded history), and 6σ events happen every 1.5 million years (essentially never). Thus if the sample extrema are 6 sigmas from the mean, one has a significant failure of normality.
Further, this test is very easy to communicate without involved statistics.
These tests of normality can be applied if one faces kurtosis risk, for instance.
Extreme value theory
 Events can be more extreme than any previously observed, as in the 1755 Lisbon earthquake.See also: Extreme value theory
Sample extrema play two main roles in extreme value theory:
- firstly, they give a lower bound on extreme events – events can be at least this extreme, and for this size sample;
- secondly, they can sometimes be used in estimators of probability of more extreme events.
However, caution must be used in using sample extrema as guidelines: in heavy-tailed distributions or for non-stationary processes, extreme events can be significantly more extreme than any previously observed event. This is elaborated in black swan theory.
See also
Summary statistics
Categories:


Wikimedia Foundation. 2010.