- Ormalingen
-
Ormalingen 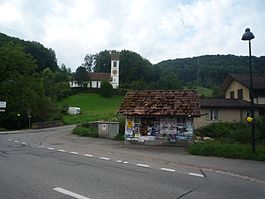
Country Switzerland 
Canton Basel-Country District Sissach 47°28′N 7°52′E / 47.467°N 7.867°ECoordinates: 47°28′N 7°52′E / 47.467°N 7.867°E Population 1,950 (Mar 2011)[1] - Density 281 /km2 (728 /sq mi) Area 6.94 km2 (2.68 sq mi) Elevation 423 m (1,388 ft) Postal code 4466 SFOS number 2856 Surrounded by Buus, Gelterkinden, Hemmiken, Rickenbach, Rothenfluh, Tecknau, Wenslingen Website www.ormalingen.ch
SFSO statistics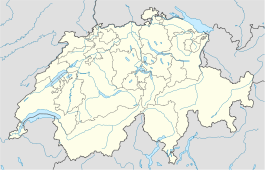
 Ormalingen
View map of Ormalingen Ormalingen is a municipality in the district of Sissach, in the canton of Basel-Country in Switzerland.
Contents
History
Ormalingen is first mentioned in 1280 as Normendingen.[2]
Geography
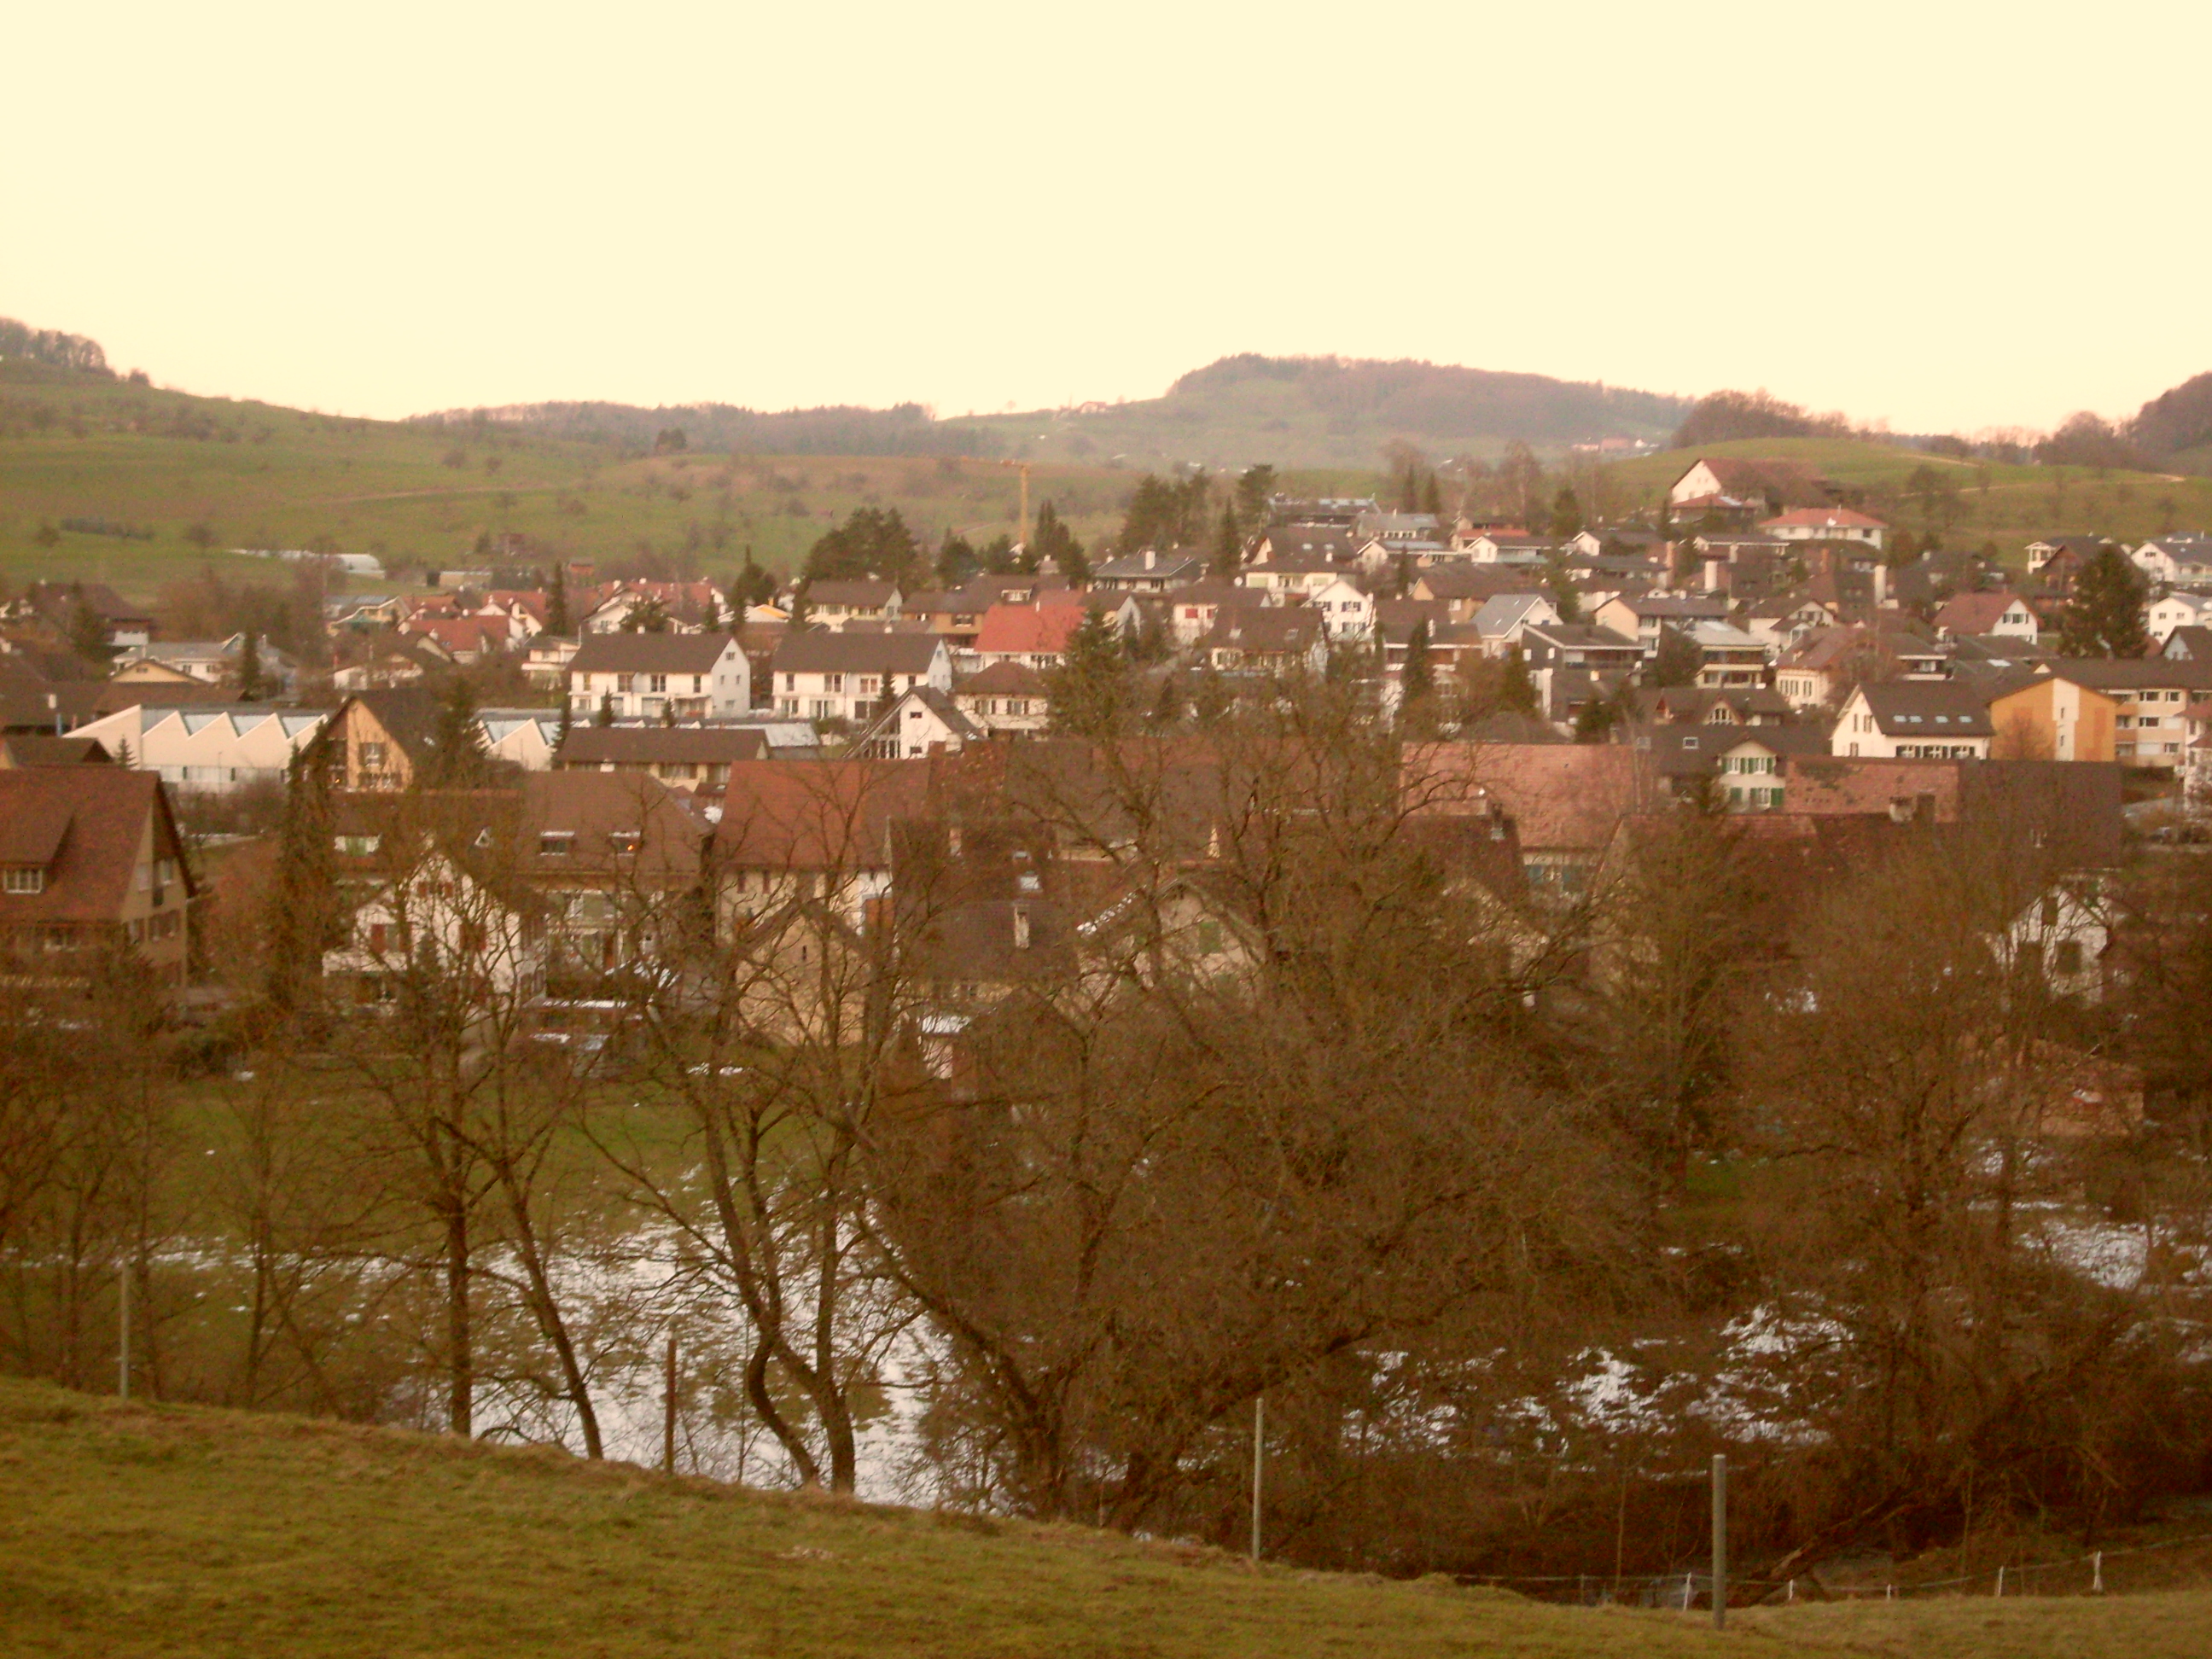
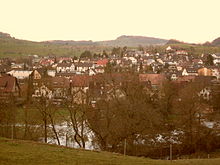 Ormalingen village
Ormalingen has an area, as of 2009[update], of 6.94 square kilometers (2.68 sq mi). Of this area, 3.54 km2 (1.37 sq mi) or 51.0% is used for agricultural purposes, while 2.6 km2 (1.0 sq mi) or 37.5% is forested. Of the rest of the land, 0.79 km2 (0.31 sq mi) or 11.4% is settled (buildings or roads), 0.01 km2 (2.5 acres) or 0.1% is either rivers or lakes.[3]
Of the built up area, industrial buildings made up 1.2% of the total area while housing and buildings made up 7.2% and transportation infrastructure made up 1.7%. Out of the forested land, 34.7% of the total land area is heavily forested and 2.7% is covered with orchards or small clusters of trees. Of the agricultural land, 14.8% is used for growing crops and 30.4% is pastures, while 5.8% is used for orchards or vine crops. All the water in the municipality is flowing water.[3]
The municipality is located in the Sissach district, in the upper Ergolz valley on the old road over the Schafmatt pass.
Coat of arms
The blazon of the municipal coat of arms is Per fess, Or, a Mullet Gules, and Azure.[4]
Demographics
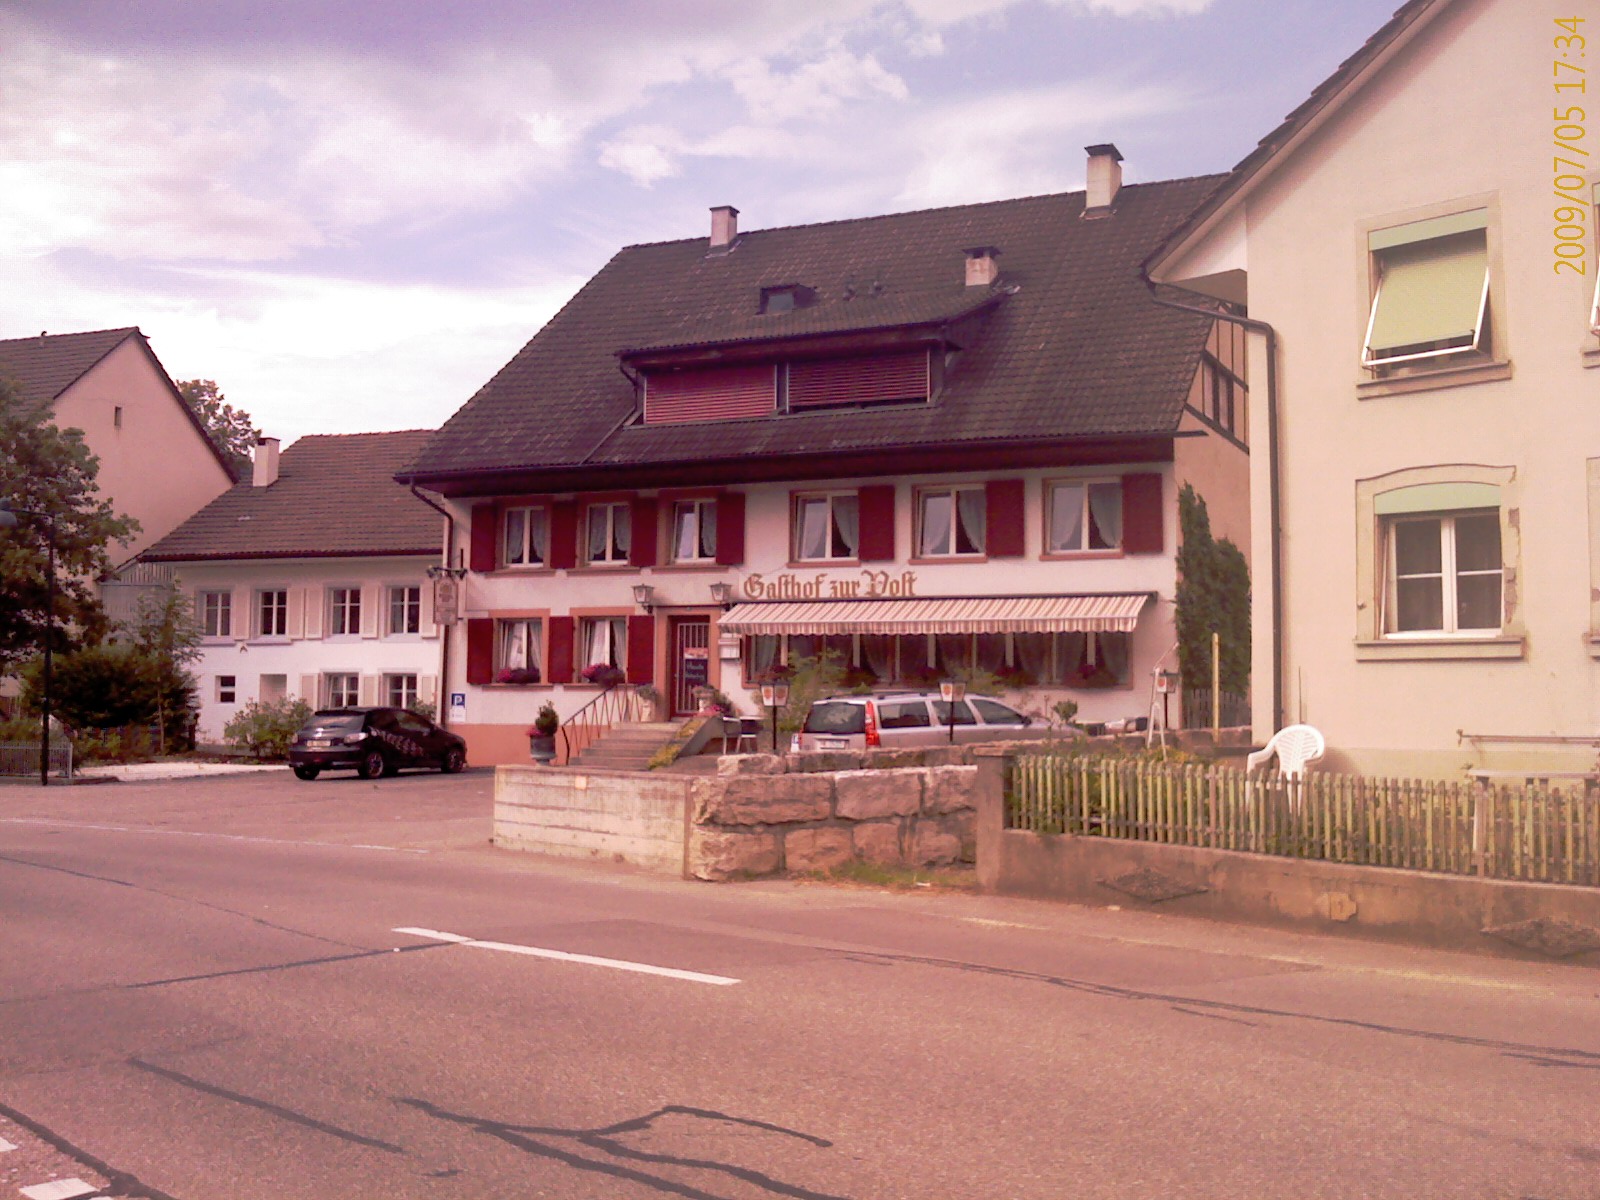
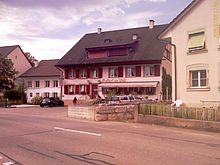 Gasthaus (hotel and restaurant) Post in Ormalingen
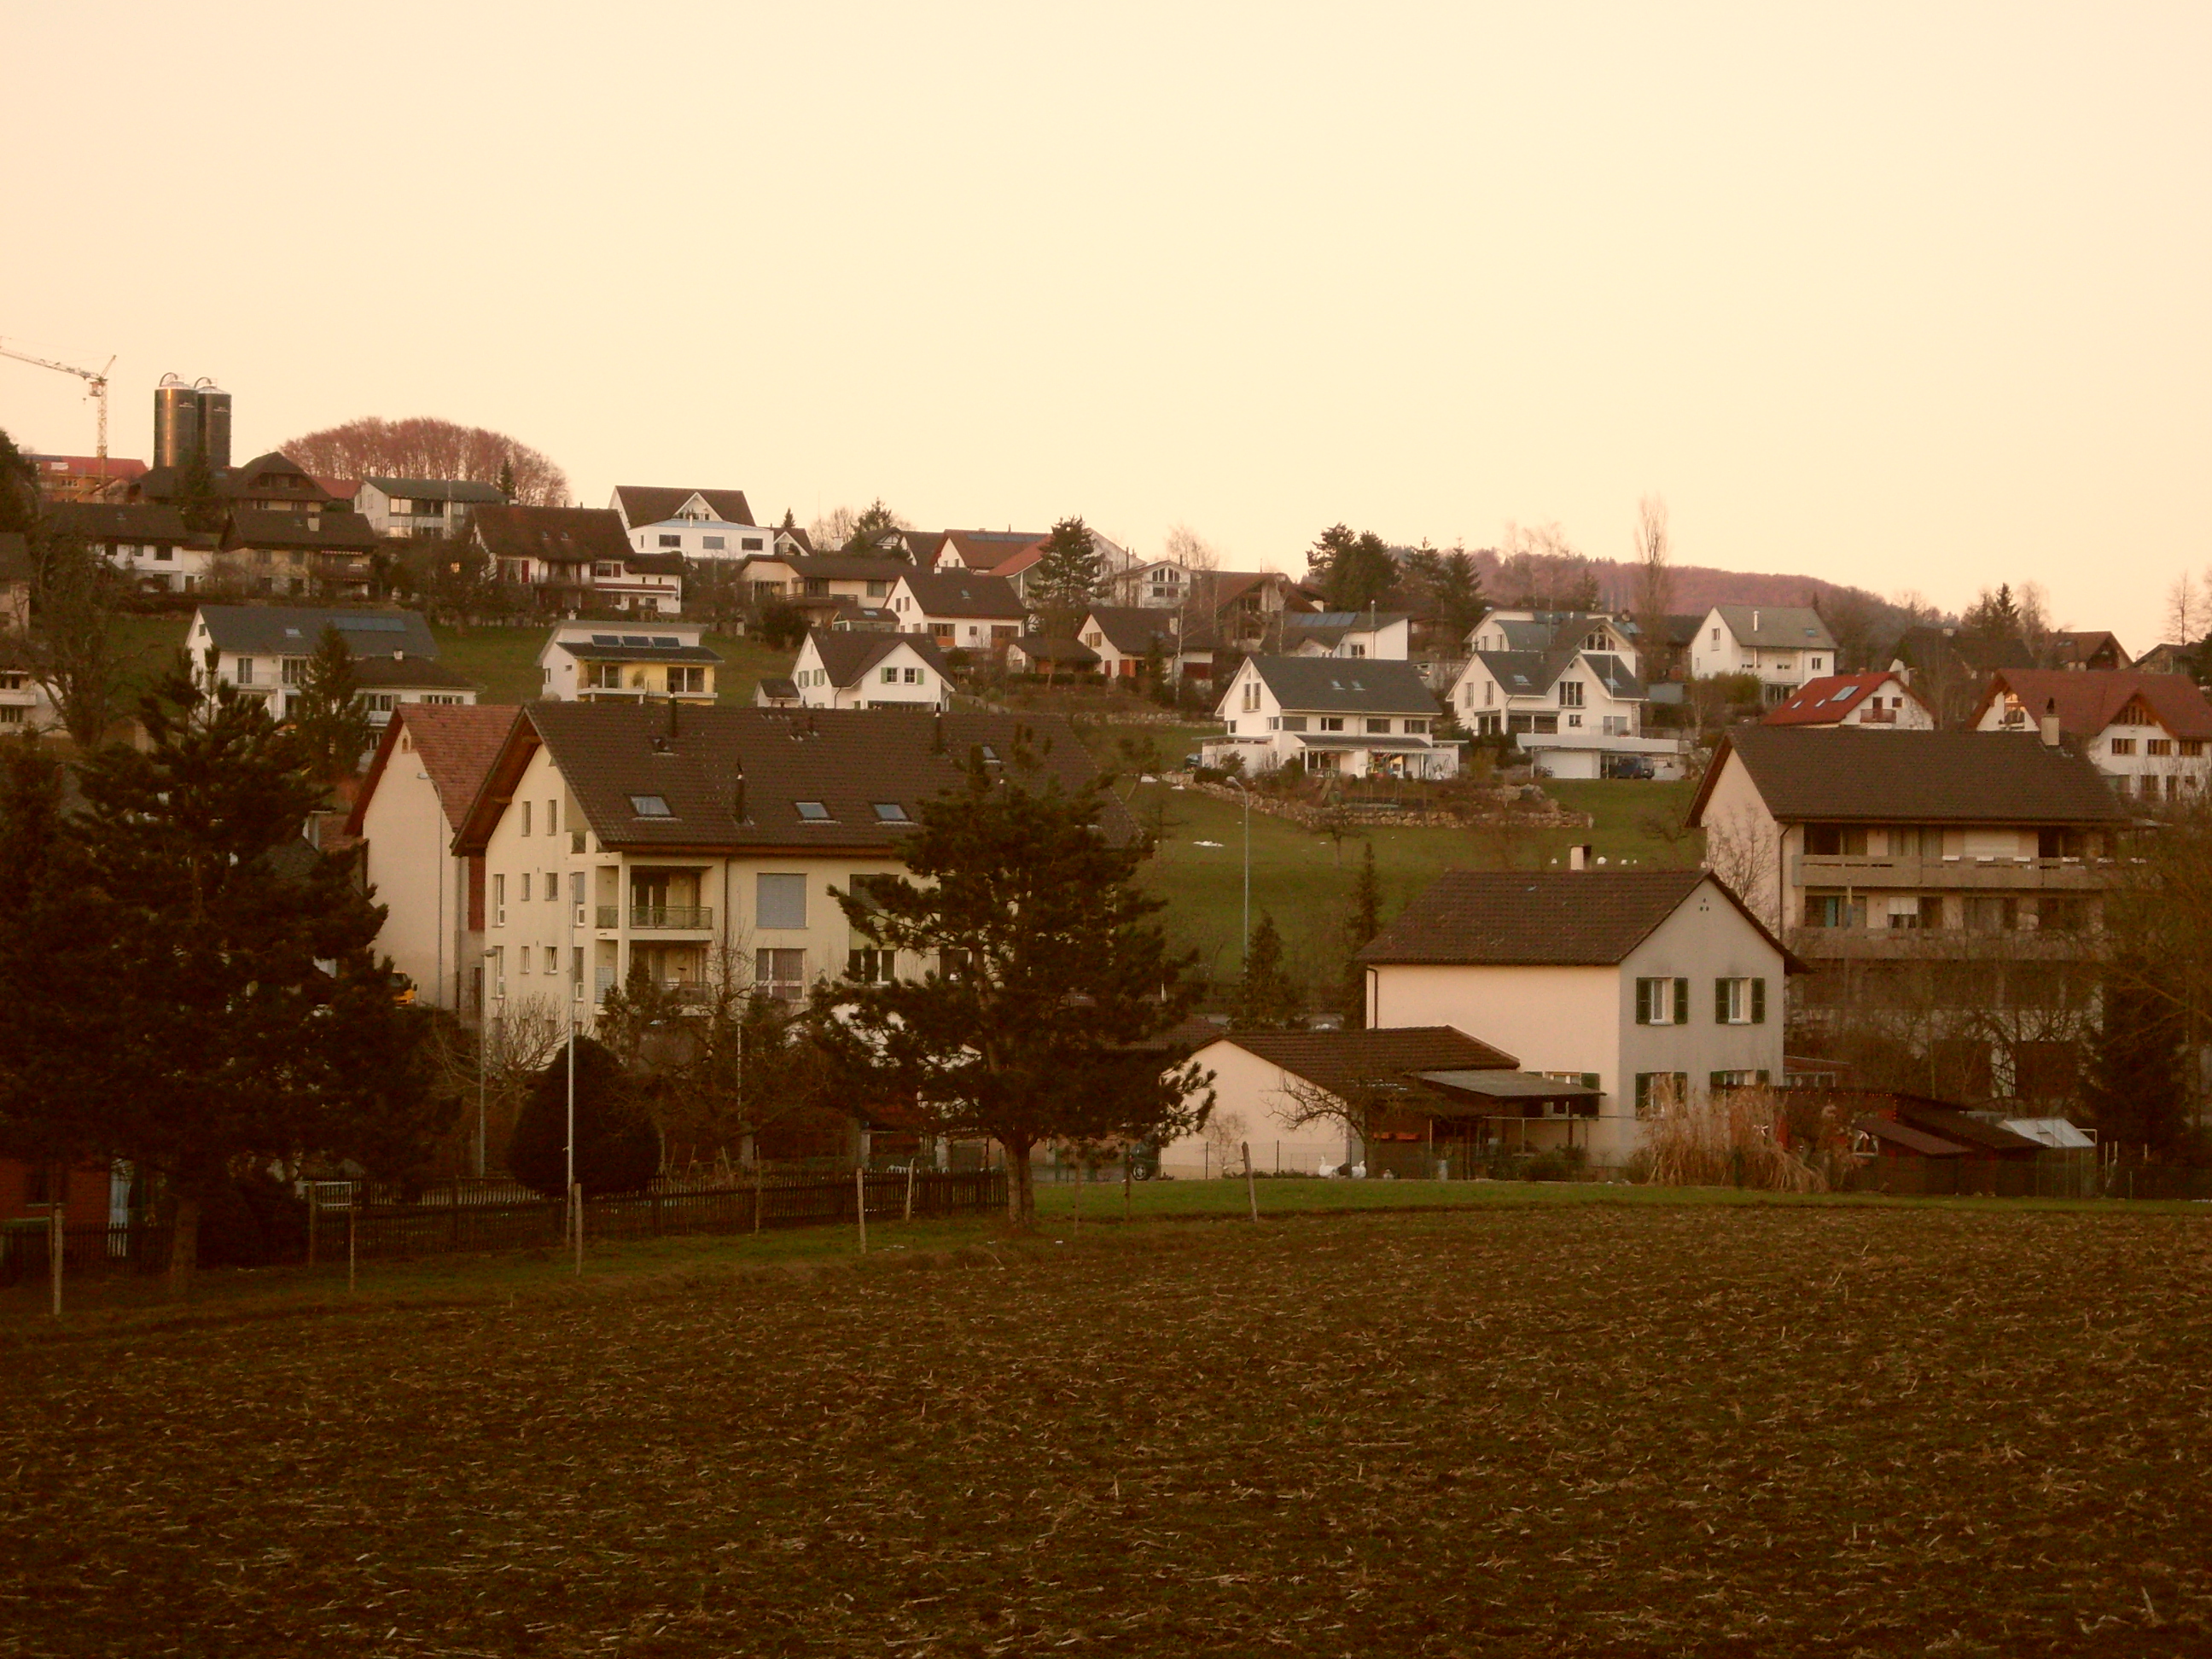
 Newer houses in Ormalingen
Ormalingen has a population (as of March 2011[update]) of 1,950.[1] As of 2008[update], 10.0% of the population are resident foreign nationals.[5] Over the last 10 years (1997–2007) the population has changed at a rate of 7.3%.[6]
Most of the population (as of 2000[update]) speaks German (1,747 or 92.9%), with Italian language being second most common (42 or 2.2%) and Albanian being third (31 or 1.6%). There are 10 people who speak French and 1 person who speaks Romansh.[7]
As of 2008[update], the gender distribution of the population was 50.6% male and 49.4% female. The population was made up of 1,727 Swiss citizens (89.4% of the population), and 205 non-Swiss residents (10.6%)[8] Of the population in the municipality 548 or about 29.1% were born in Ormalingen and lived there in 2000. There were 626 or 33.3% who were born in the same canton, while 402 or 21.4% were born somewhere else in Switzerland, and 215 or 11.4% were born outside of Switzerland.[7]
In 2008[update] there were 11 live births to Swiss citizens and 1 birth to non-Swiss citizens, and in same time span there were 11 deaths of Swiss citizens and 2 non-Swiss citizen deaths. Ignoring immigration and emigration, the population of Swiss citizens remained the same while the foreign population decreased by 1. There were 2 Swiss men who immigrated back to Switzerland. At the same time, there were 2 non-Swiss men and 3 non-Swiss women who immigrated from another country to Switzerland. The total Swiss population change in 2008 (from all sources, including moves across municipal borders) was an increase of 20 and the non-Swiss population increased by 4 people. This represents a population growth rate of 1.3%.[5]
The age distribution, as of 2010[update], in Ormalingen is; 94 children or 4.9% of the population are between 0 and 6 years old and 312 teenagers or 16.1% are between 7 and 19. Of the adult population, 238 people or 12.3% of the population are between 20 and 29 years old. 238 people or 12.3% are between 30 and 39, 357 people or 18.5% are between 40 and 49, and 391 people or 20.2% are between 50 and 64. The senior population distribution is 232 people or 12.0% of the population are between 65 and 79 years old and there are 70 people or 3.6% who are over 80.[8]
As of 2000[update], there were 777 people who were single and never married in the municipality. There were 905 married individuals, 122 widows or widowers and 77 individuals who are divorced.[7]
As of 2000[update] the average number of residents per living room was 0.58 which is about equal to the cantonal average of 0.56 per room. In this case, a room is defined as space of a housing unit of at least 4 m2 (43 sq ft) as normal bedrooms, dining rooms, living rooms, kitchens and habitable cellars and attics.[9] About 59.8% of the total households were owner occupied, or in other words did not pay rent (though they may have a mortgage or a rent-to-own agreement).[10]
As of 2000[update], there were 703 private households in the municipality, and an average of 2.6 persons per household.[6] There were 169 households that consist of only one person and 61 households with five or more people. Out of a total of 712 households that answered this question, 23.7% were households made up of just one person and 11 were adults who lived with their parents. Of the rest of the households, there are 218 married couples without children, 259 married couples with children There were 37 single parents with a child or children. There were 9 households that were made up unrelated people and 9 households that were made some sort of institution or another collective housing.[7]
In 2000[update] there were 360 single family homes (or 72.7% of the total) out of a total of 495 inhabited buildings. There were 63 multi-family buildings (12.7%), along with 49 multi-purpose buildings that were mostly used for housing (9.9%) and 23 other use buildings (commercial or industrial) that also had some housing (4.6%). Of the single family homes 41 were built before 1919, while 97 were built between 1990 and 2000. The greatest number of single family homes (79) were built between 1971 and 1980.[11]
In 2000[update] there were 735 apartments in the municipality. The most common apartment size was 5 rooms of which there were 210. There were 19 single room apartments and 316 apartments with five or more rooms. Of these apartments, a total of 681 apartments (92.7% of the total) were permanently occupied, while 38 apartments (5.2%) were seasonally occupied and 16 apartments (2.2%) were empty.[11] As of 2007[update], the construction rate of new housing units was 3.2 new units per 1000 residents.[6] As of 2000[update] the average price to rent a two room apartment was about 782.00 CHF (US$630, £350, €500), a three room apartment was about 1040.00 CHF (US$830, £470, €670) and a four room apartment cost an average of 1318.00 CHF (US$1050, £590, €840).[12] The vacancy rate for the municipality, in 2008[update], was 0%.[6]
The historical population is given in the following chart:[2][13]

Heritage sites of national significance
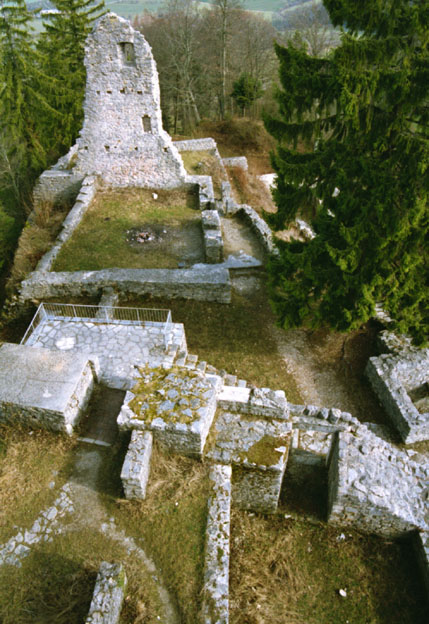
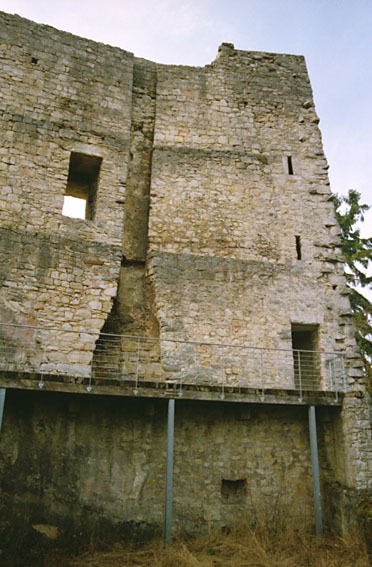
The Ruins of Farnsburg Castle is listed as a Swiss heritage site of national significance.[14]
Farnsburg Castle was built in the 14th Century as the seat of the Counts of Thierstein.[15]
-
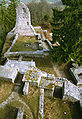
Farnsburg Castle site
-
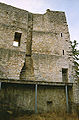
Chimmney and wall of Farnsburg Castle
-
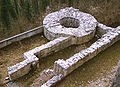
Foundation of a round tower
-
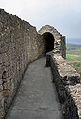
Portion of the old wall
Politics
In the 2007 federal election the most popular party was the SVP which received 32.78% of the vote. The next three most popular parties were the SP (22.82%), the FDP (16.92%) and the Green Party (16.7%). In the federal election, a total of 652 votes were cast, and the voter turnout was 48.0%.[16]
Economy
As of 2007[update], Ormalingen had an unemployment rate of 1.67%. As of 2005[update], there were 71 people employed in the primary economic sector and about 18 businesses involved in this sector. 265 people were employed in the secondary sector and there were 29 businesses in this sector. 287 people were employed in the tertiary sector, with 46 businesses in this sector.[6] There were 990 residents of the municipality who were employed in some capacity, of which females made up 42.1% of the workforce.
In 2008[update] the total number of full-time equivalent jobs was 506. The number of jobs in the primary sector was 47, all of which were in agriculture. The number of jobs in the secondary sector was 250, of which 97 or (38.8%) were in manufacturing and 152 (60.8%) were in construction. The number of jobs in the tertiary sector was 209. In the tertiary sector; 73 or 34.9% were in the sale or repair of motor vehicles, 11 or 5.3% were in the movement and storage of goods, 16 or 7.7% were in a hotel or restaurant, 2 or 1.0% were in the information industry, 1 or 0.5% were the insurance or financial industry, 9 or 4.3% were technical professionals or scientists, 15 or 7.2% were in education and 68 or 32.5% were in health care.[17]
In 2000[update], there were 332 workers who commuted into the municipality and 728 workers who commuted away. The municipality is a net exporter of workers, with about 2.2 workers leaving the municipality for every one entering. About 2.1% of the workforce coming into Ormalingen are coming from outside Switzerland.[18] Of the working population, 20.3% used public transportation to get to work, and 45.6% used a private car.[6]
Religion
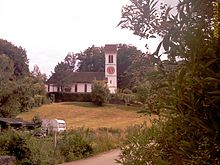 Church in Ormalingen
From the 2000 census[update], 301 or 16.0% were Roman Catholic, while 1,254 or 66.7% belonged to the Swiss Reformed Church. Of the rest of the population, there were 9 members of an Orthodox church (or about 0.48% of the population), there were 3 individuals (or about 0.16% of the population) who belonged to the Christian Catholic Church, and there were 56 individuals (or about 2.98% of the population) who belonged to another Christian church. There were 58 (or about 3.08% of the population) who were Islamic. There was 1 person who was Buddhist and 1 individual who belonged to another church. 137 (or about 7.28% of the population) belonged to no church, are agnostic or atheist, and 61 individuals (or about 3.24% of the population) did not answer the question.[7]
Education
In Ormalingen about 778 or (41.4%) of the population have completed non-mandatory upper secondary education, and 190 or (10.1%) have completed additional higher education (either university or a Fachhochschule). Of the 190 who completed tertiary schooling, 73.7% were Swiss men, 18.4% were Swiss women, 5.3% were non-Swiss men and 2.6% were non-Swiss women.[7]
As of 2000[update], there were 42 students in Ormalingen who came from another municipality, while 147 residents attended schools outside the municipality.[18]
References
- ^ a b Canton of Basel-Land Statistics, Wohnbevölkerung nach Nationalität und Konfession per 31. März 2011 (German) accessed 17 July 2011
- ^ a b Ormalingen in German, French and Italian in the online Historical Dictionary of Switzerland.
- ^ a b Swiss Federal Statistical Office-Land Use Statistics 2009 data (German) accessed 25 March 2010
- ^ Flags of the World.com accessed 06-March-2011
- ^ a b Swiss Federal Statistical Office - Superweb database - Gemeinde Statistics 1981-2008 (German) accessed 19 June 2010
- ^ a b c d e f Swiss Federal Statistical Office accessed 06-March-2011
- ^ a b c d e f STAT-TAB Datenwürfel für Thema 40.3 - 2000 (German) accessed 2 February 2011
- ^ a b Canton of Basel-Land Statistics, Wohnbevölkerung nach Nationalität und Konfession per 30. September 2010 (German) accessed 16 February 2011
- ^ Eurostat. "Housing (SA1)" (pdf). Urban Audit Glossary. 2007. p. 18. http://www.bfs.admin.ch/bfs/portal/en/index/international/22/lexi.Document.116365.pdf. Retrieved 12 February 2010.
- ^ Urban Audit Glossary pg 17
- ^ a b Federal Statistical Office STAT-TAB - Datenwürfel für Thema 09.2 - Gebäude und Wohnungen (German) accessed 28 January 2011
- ^ Canton of Basel-Land Statistics, Mieter- und Genossenschafterwohnungen1 nach Zimmerzahl und Mietpreis 2000 (German) accessed 20 February 2011
- ^ Swiss Federal Statistical Office STAT-TAB Bevölkerungsentwicklung nach Region, 1850-2000 (German) accessed 29 January 2011
- ^ "Kantonsliste A-Objekte:Basel-Landschaft" (in German). KGS Inventar. Federal Office of Civil Protection. 2009. http://www.bevoelkerungsschutz.admin.ch/internet/bs/de/home/themen/kgs/kgs_inventar/a-objekte.parsys.000101.DownloadFile.tmp/bl.pdf. Retrieved 12 July 2010.
- ^ Flüeler (1982). Kulturführer Schweiz. Zurich, CH: Ex Libris Verlag AG. pp. 274.
- ^ Swiss Federal Statistical Office, Nationalratswahlen 2007: Stärke der Parteien und Wahlbeteiligung, nach Gemeinden/Bezirk/Canton (German) accessed 28 May 2010
- ^ Swiss Federal Statistical Office STAT-TAB Betriebszählung: Arbeitsstätten nach Gemeinde und NOGA 2008 (Abschnitte), Sektoren 1-3 (German) accessed 28 January 2011
- ^ a b Swiss Federal Statistical Office - Statweb (German) accessed 24 June 2010
External links
- Official website (German)
Anwil · Böckten · Buckten · Buus · Diepflingen · Gelterkinden · Häfelfingen · Hemmiken · Itingen · Känerkinden · Kilchberg · Läufelfingen · Maisprach · Nusshof · Oltingen · Ormalingen · Rickenbach · Rothenfluh · Rümlingen · Rünenberg · Sissach · Tecknau · Tenniken · Thürnen · Wenslingen · Wintersingen · Wittinsburg · Zeglingen · Zunzgen
 Categories:
- Municipalities of Basel-Country
- Municipalities of Switzerland
- Cultural property of national significance in the canton of Basel-Country
-


Wikimedia Foundation. 2010.